Fig. 2.
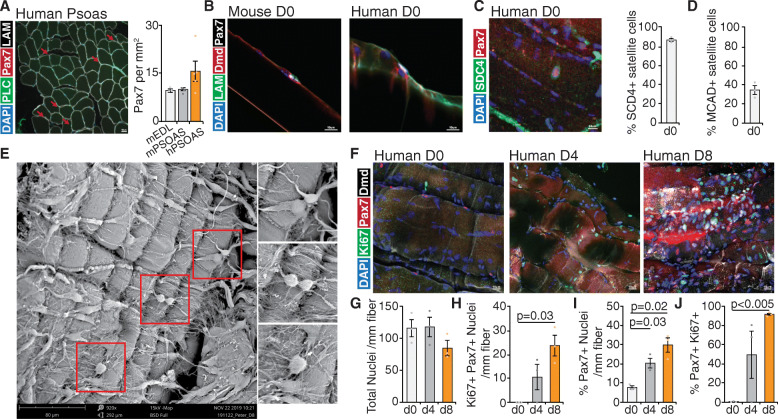
Human satellite cells expand in culture. a Representative image and quantification of satellite cell density from human Psoas minor muscle cross sections stained with DAPI (blue), Perlecan (green), Pax7 (red), and Laminin (white). b Representative images of mouse and human satellite cells in the niche at isolation stained for DAPI (blue), Laminin (green), dystrophin (red) and Pax7 (white). c Representative image and quantification of human satellite cells expressing Syndecan-4 (SDC4) at isolation stained with DAPI (blue), Syndecan-4 (green), and Pax7 (red). d Quantification of human satellite cells expressing M-Cadherin (MCAD) at isolation. e Representative scanning electron micrograph of cultured human myofibers (day 8) showing maintenance of myofiber extracellular matrix composition and cell-cell contacts. f Representative images of human myofibers in culture from day 0, day 4, and day 8 stained with DAPI (blue), Ki67 (green), Pax7 (red), and dystrophin (white). Quantification of g total nuclei per mm of myofiber, h satellite cells expressing Ki67 per millimeter of myofiber, i percentage of satellite cells per total nuclei per mm of myofiber, j proportion of satellite cells expressing Ki67 on myofibers. a, c, d, g–j Error bars represent mean ± SEM; a n = 3 biological replicates for mouse EDL, mouse Psoas, n = 5 biological replicates from human Psoas. c, d, g–j n = 3 biological replicates

