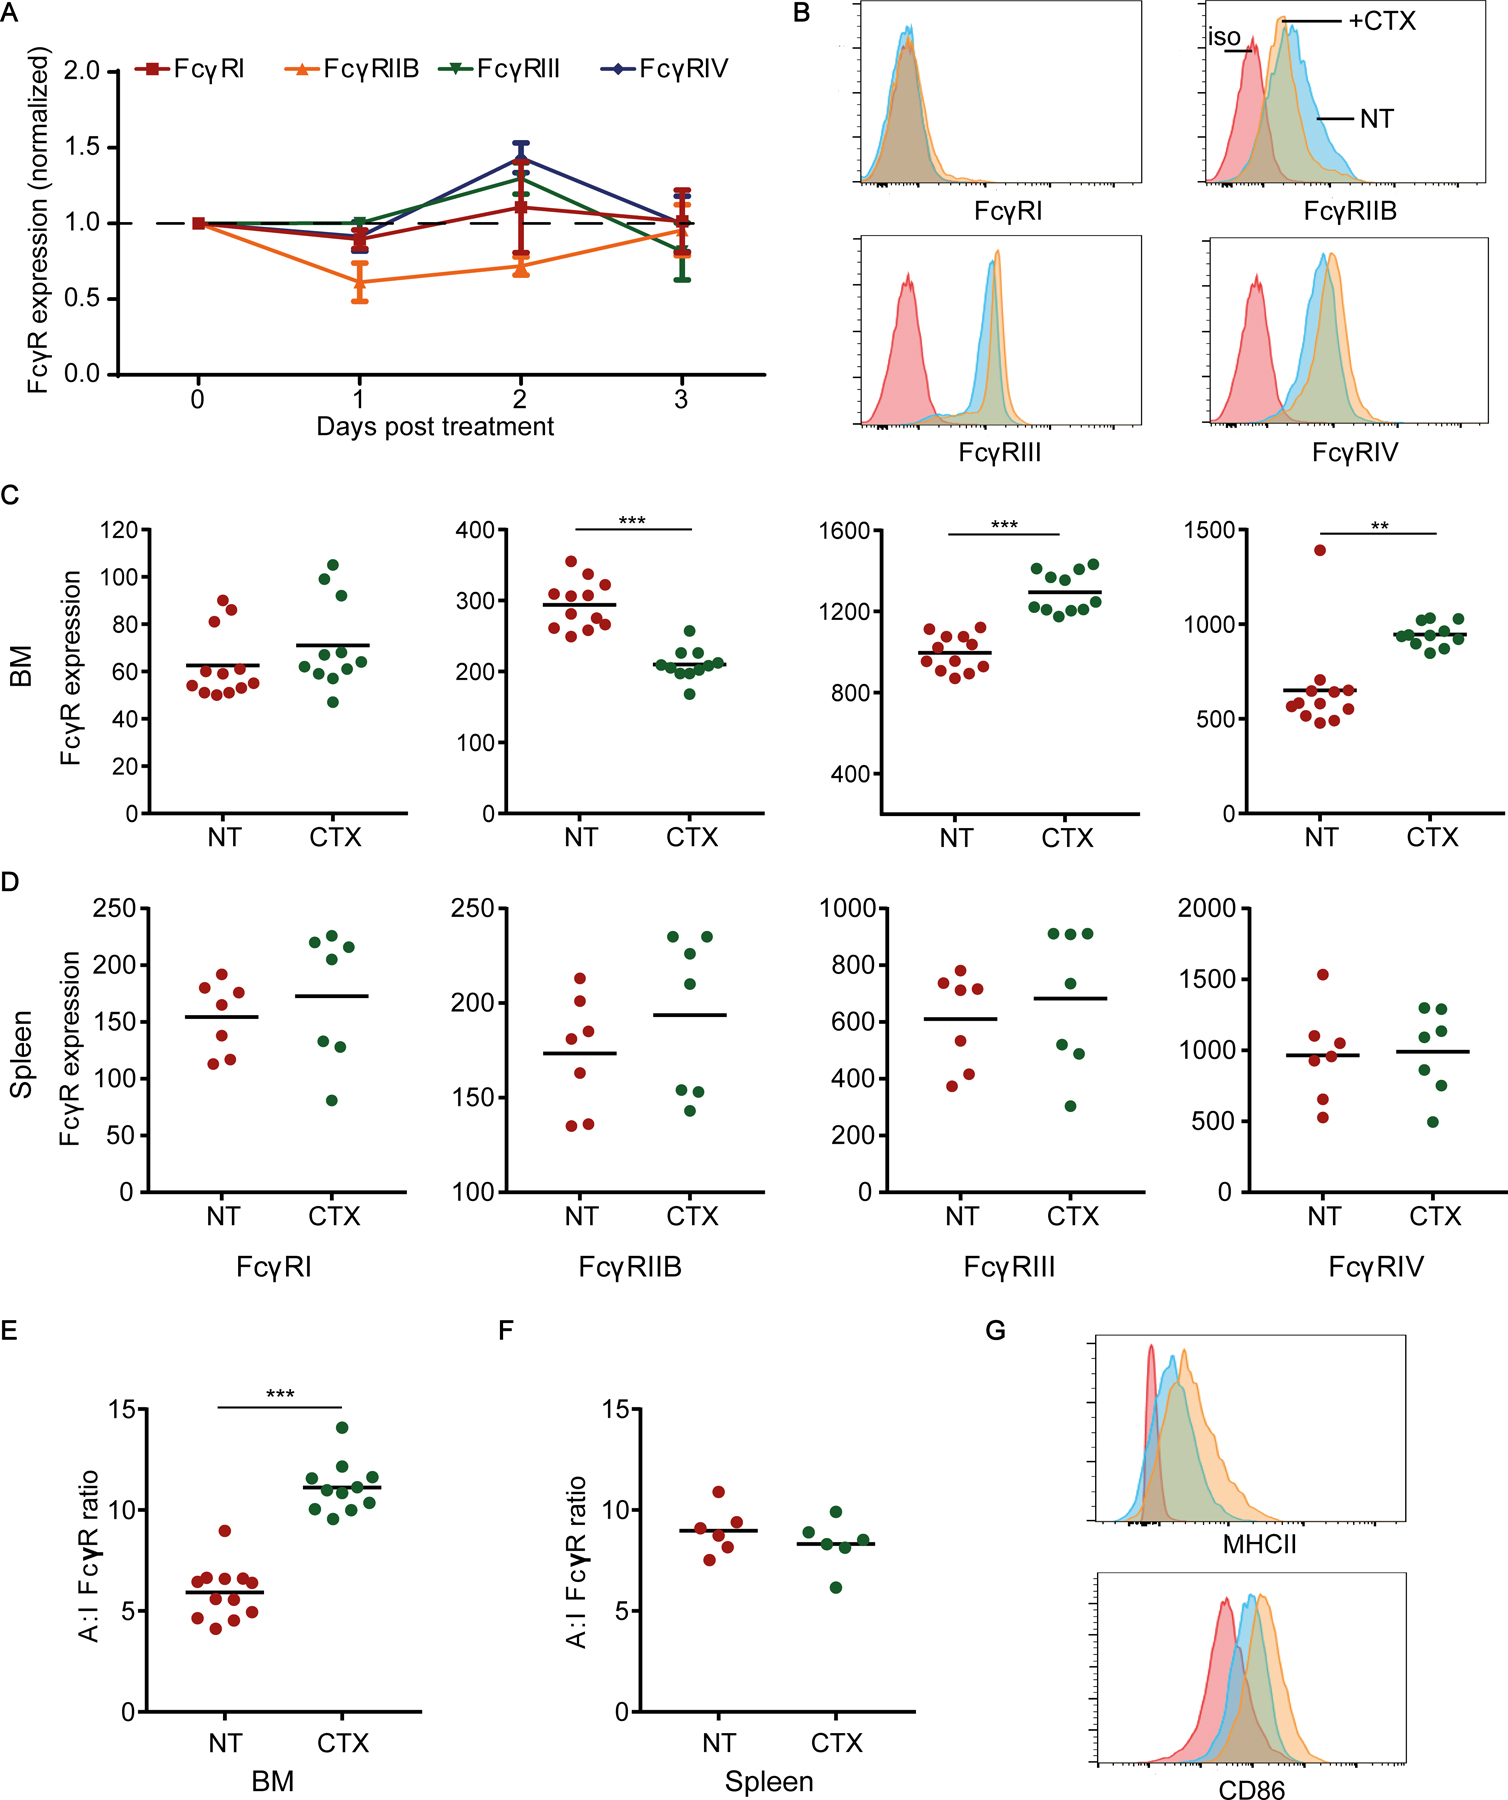
Figure 2. CTX treatment induces a higher A:I FcγR ratio in BM-resident, but not splenic, macrophages in non-tumor-bearing mice.

(A) FcγR expression on F4/80+ macrophages in the BM 1, 2, and 3 days after CTX treatment normalized to corresponding FcγR expression on untreated F4/80+ macrophages in the BM of control non-treated (NT) mice. Mean ± SD shown; 5 mice/group of 1 experiment. (B-D) Comparison of FcγR expression by F4/80+ macrophages in the BM and spleen of NT and CTX-treated NSG mice (2 days post-treatment). (B) Representative flow cytometry histograms of various FcγR expression by BM F4/80+ macrophages (4–5 mice/group, combined from at least 2 independent experiments). Red trace: isotype (iso) control; blue trace: NT; orange trace: CTX treated. Comparison of FcγR expression by F4/80+ macrophages in the (C) BM and (D) spleen of NT and CTX-treated NSG mice (2 days after CTX treatment). (E-F) Comparison of A:I FcγR ratio on F4/80+ macrophages from (E) BM and (F) spleen of NT and CTX-treated mice. (G) Representative flow cytometry histograms showing MHC class II and CD86 expression by BM F4/80+ macrophages. Red trace: isotype control; blue trace: NT; orange trace: CTX-treated (day 2). Median figures are shown for flow cytometry graphs. Each dot in C-F represents one mouse (combined from at least 2 independent experiments); **p< 0.001, ***p< 0.0001 by Mann-Whitney test.
