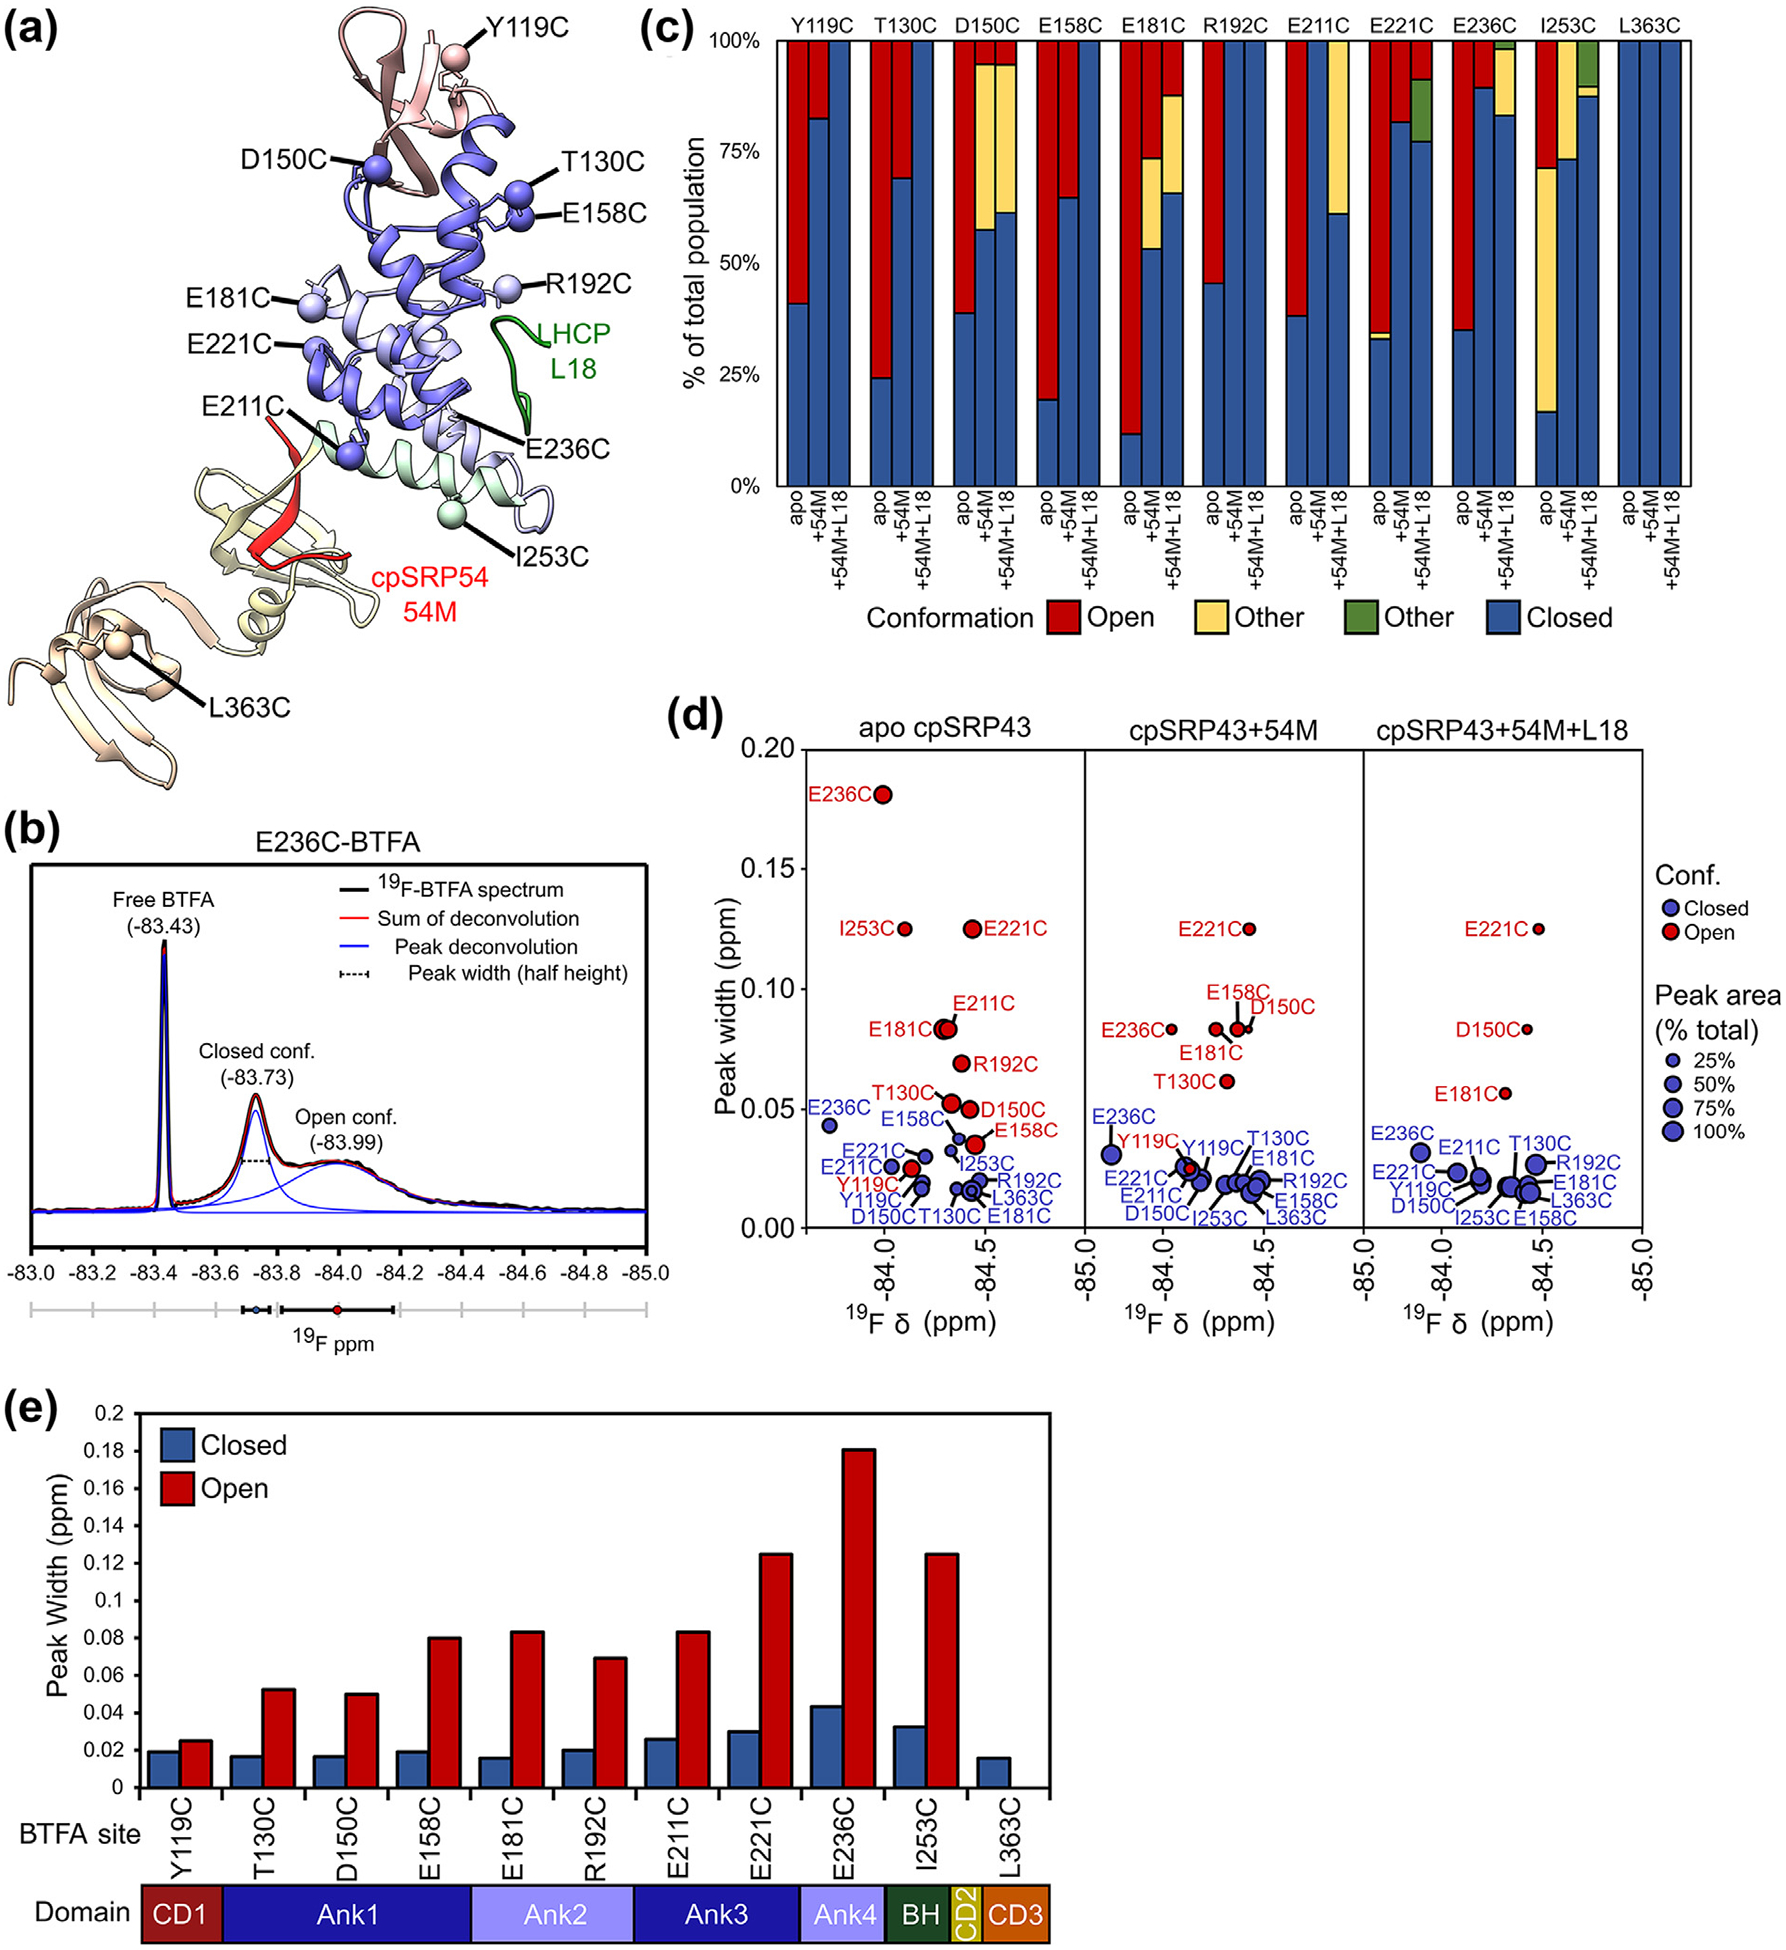
Figure 3.

Analysis of the19F NMR spectra of BTFA-labeled cpSRP43. (a) Composite structural model of cpSRP43 based on the coordinates for SBD-CD2 (PDB: 3UI2) and CD2-CD3 (PDB: 5E4W). BTFA terminal carbons are shown as labeled spheres. The individual domains are colored to match the diagram in C. Interacting peptides from binding partners (L18, 54 M) are indicated. (b) Example of a deconvolution of the 19F spectrum for E236C-BTFA, with the experimental data in black, individual component peaks in blue, and the sum of the component peaks in red. Three parameters can be extracted: the chemical shift of the peak center (ppm), the peak width (ppm), and the peak area. (c) Summary of the relative abundance of component cross peaks for the indicated BTFA probe sites in apo cpSRP43, cpSRP43 + 54 M, and cpSRP43 + 54 M + L18, calculated from deconvolution of the 19F NMR spectra for BTFA shown in (b). (d) Comparison of the chemical shift and peak width for component cross peaks for the closed (blue circles) and open (red circles) conformations in apo cpSRP43 (left), cpSRP43 bound to 54 M peptide (middle), and cpSRP43 bound to both the 54 M and L18 peptides. The size of the circle indicates the relative abundance of the component peak. (e) Summary of the line widths of the 19F resonances in the closed (blue) and open (red) conformations of apo cpSRP43 for the indicated BTFA-labeled sites. (For interpretation of the references to color in this figure legend, the reader is referred to the web version of this article.)
