
Figure 4.
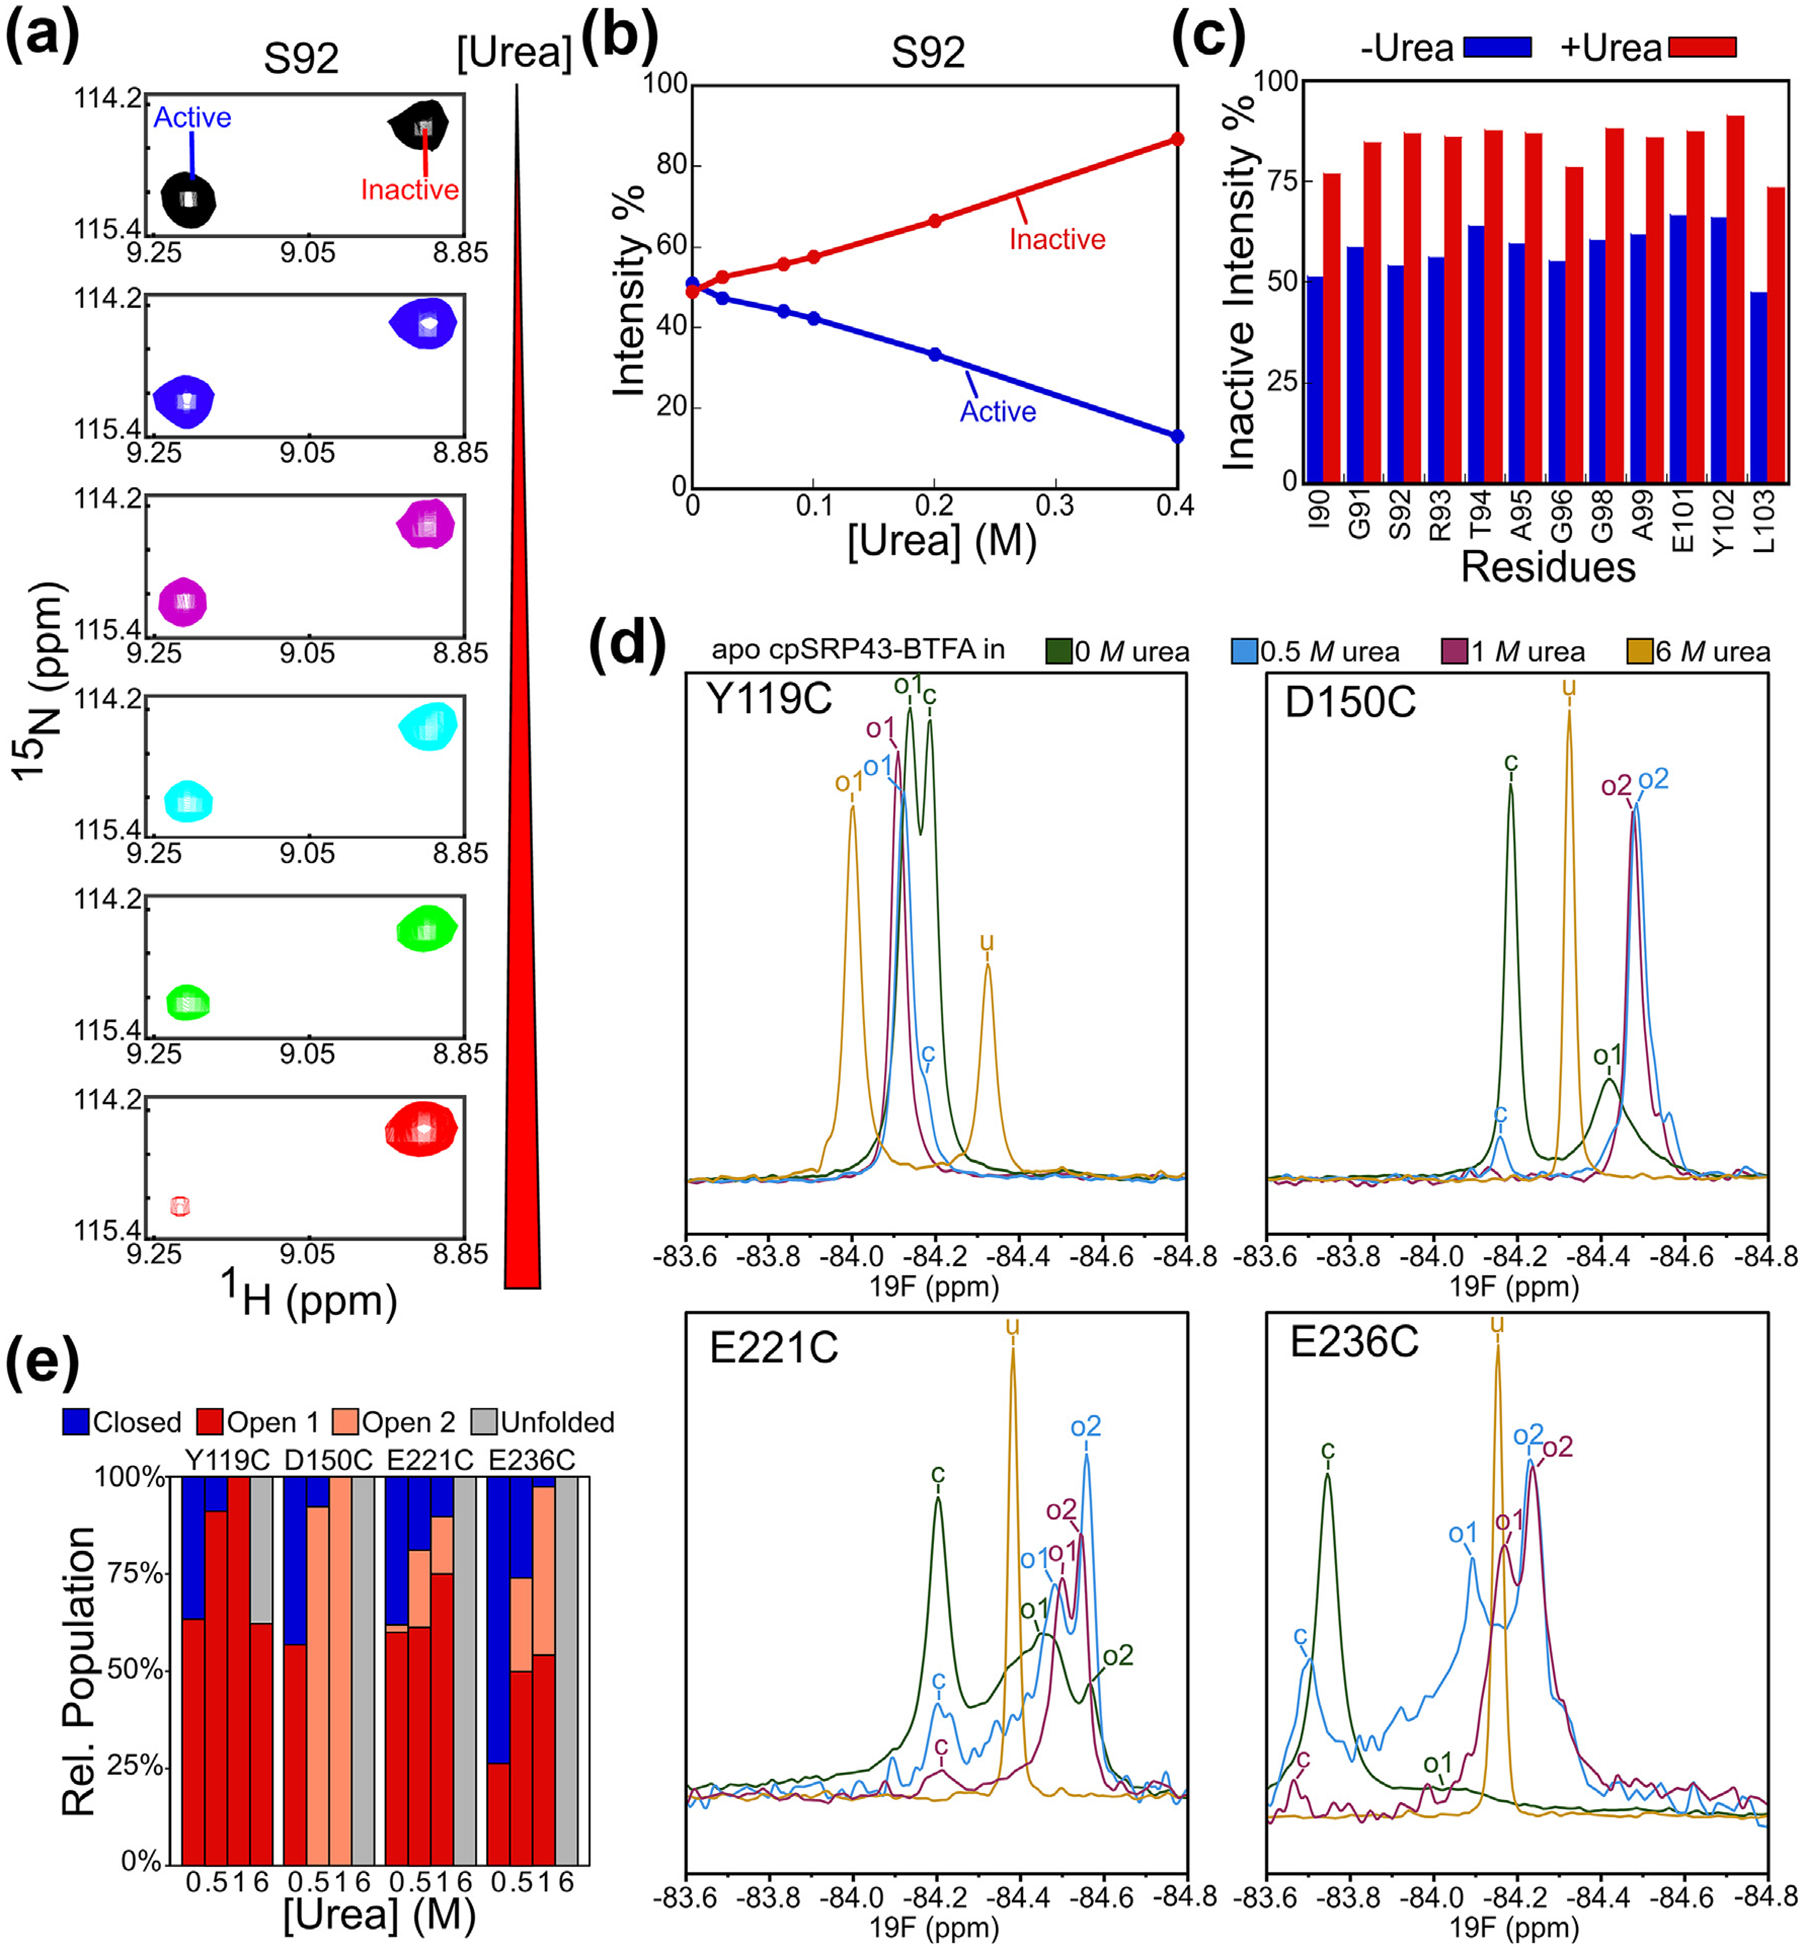
Low doses of urea drive cpSRP43 into the open state. (A) Effect of urea on the relative intensity of the component cross peaks for Ser92 in the TROSY spectra of 2H, 15N-labeled apo cpSRP43. (B) Quantification of the data in part A. (C) Summary of the effects of urea on the relative intensities of the open conformation cross peaks at the indicated residues. Relative intensities were determined from cross peak heights. (D) 19F 1D NMR spectra on BTFA-labeled apo cpSRP43 at 0 M (green), 0.5 M (blue), 1 M (purple), and 6 M (yellow) urea. The assigned peaks are labeled by conformation: closed (c), open 1 (o1), open 2 (o2), and unfolded (u). (E) Relative populations of closed (blue), open 1 (red), and open 2 (pink), and unfolded (gray) peaks at the indicated urea concentrations. (For interpretation of the references to color in this figure legend, the reader is referred to the web version of this article.)