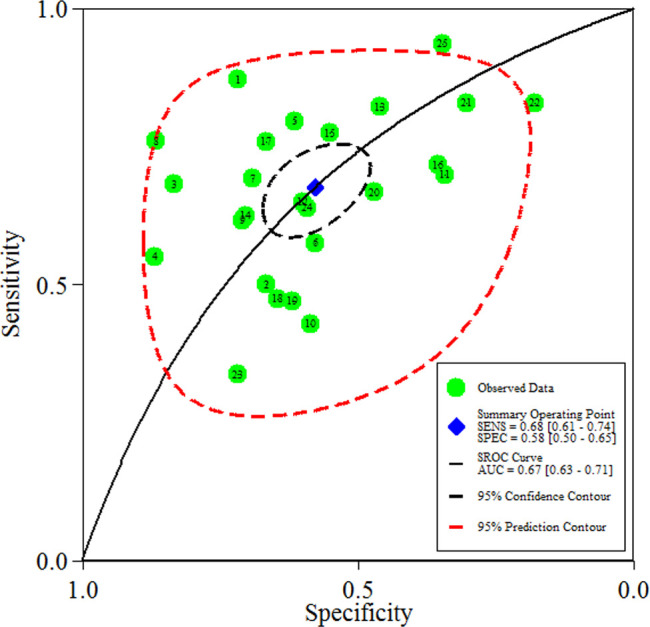
Figure 4.

Hierarchical SROC plot showing average sensitivity and specificity estimate of the study results with 95% confidence region. The 95% prediction region represents the confidence region for a forecast of the true sensitivity (SENS) and specificity (SPEC) in a future study. AUC, area under the curve; SROC, summary receiver operating characteristic.
