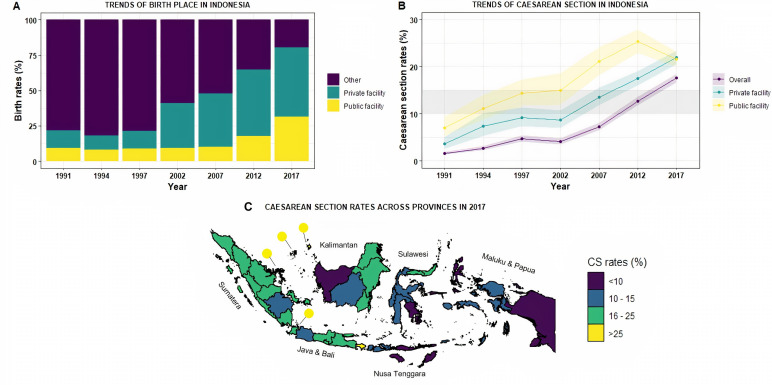
Figure 1.
Trends of birth and CSRs from 1991 to 2017 and regional variations on CS rates in 2017. Panel A shows trends of births at different type of birth facility in Indonesia from 1991 to 2017, while panel B shows CSRs at different type of birth facility. Detailed table listed on online supplemental table 1. The grey horizontal band on panel B indicates the 10%–15% optimal range for CS at a population level, while the coloured band indicates the 95% CI of CSRs estimate at among all births, among births at private facilities, and among births at public facilities. Panel C shows CSRs across 34 provinces in Indonesia, listed on online supplemental table 2. CS, caesarean section; CSRs, CS rates.

