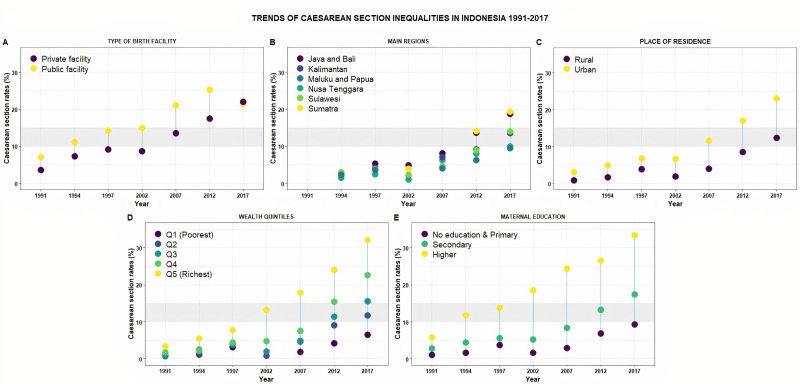
Figure 2.
Trends in absolute inequalities of CS across different socioeconomic determinants in Indonesia from 1991 to 2017. Vertical blue lines indicate the absolute difference of CSRs across different socioeconomic status. The grey horizontal band indicates 10%–15% optimal range for CS at a population level. Detailed table listed on table 1. CS, caesarean section; CSRs, CS rates.

