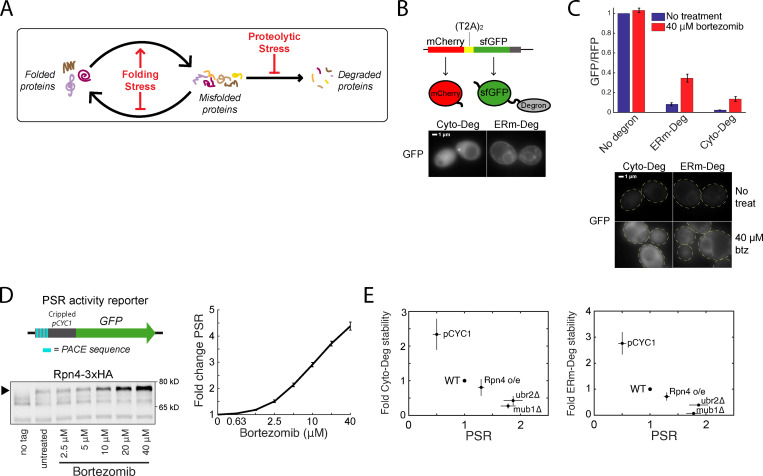
Figure 1.
Clearance of defective proteins scales with the PSR. (A) Diagram of protein folding and degradation, and the effect of folding and proteolytic stress. (B) Top: Schematic of T2A system for controlled expression of degron reporters. Bottom: GFP localization of Cyto-Deg and ERm-Deg in normal conditions. (C) Top: Mean RFP-normalized GFP fluorescence of Cyto-Deg, ERm-Deg, and a no degron control with either 0 µM (blue bars) or 40 µM (red bars) bortezomib. Bottom: GFP localization of Cyto-Deg and ERm-Deg in either 0 µM or 40 μM bortezomib conditions. Cells are outlined in yellow dashed lines. (D) Top left: Schematic of PSR activity reporter. Bottom left: Immunoblot of HA-tagged endogenous Rpn4 under a serial titration of bortezomib. Arrow indicates the position of Rpn4-3xHA. Right: Mean forward scatter normalized GFP of PSR activity reporter under a serial titration of bortezomib. Units are fold change from no treatment. (E) Plots of fold degron stability (left: Cyto-Deg; right: ERm-Deg) versus fold PSR upon modifying Rpn4 levels through deletion of UBR2 or MUB1, replacement of the endogenous RPN4 promoter with pCYC1, or expression of a second copy of RPN4 from a plasmid. Error bars denote standard error for n = 3 biological replicates. btz, bortezomib; PACE, proteasome-associated control element; treat, treatment.

