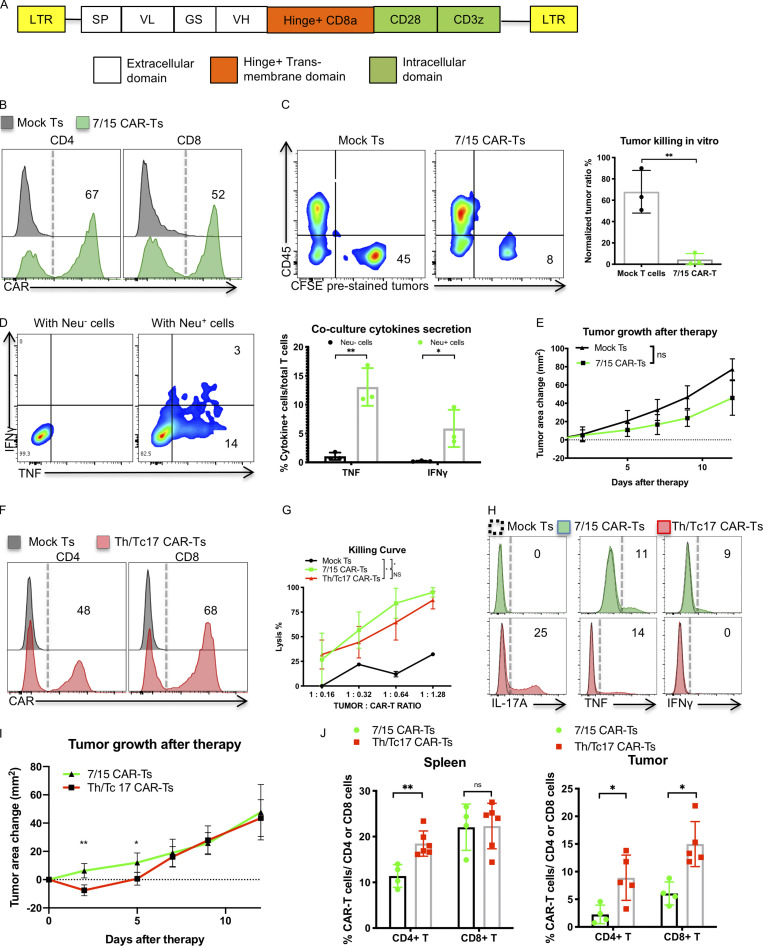
Figure 1.
Th/Tc17 CAR T cells exhibit enhanced early control of tumor growth over 7/15 CAR T cells owing to enhanced persistence in the tumor. (A) Schematic of the LH28z CAR cassette encoding the scFv (7.16.4), hinge, and transmembrane domain from CD8, and intracellular domains from CD28 and CD3ζ. (B) Expression of CAR T receptor on transduced murine 7/15 CD4+ (left) and CD8+ (right) T cells. (C) Representative flow cytometry histograms depicting viability of Neu+ NT2 tumor cells in vitro after 3 d of coculture with 7/15 CAR T cells. Tumor cells were prelabeled with CFSE and plated before the addition of CAR T cells at a 1:1 ratio with tumor cells. (D) Intracellular staining illustrating IFN-γ and TNF production by 7/15 CAR T cells after coculture with Neu+ cells or Neu− 3T3 cells at a 2:1 ratio. (E) Tumor area change (tumor area before therapy subtracted from area after therapy) was determined and compared in FVB-neu mice that received 7/15 CAR T cells or mock-transduced T cells (Mock Ts). (F) Expression of CAR T receptor on transduced Th17 (left) or Tc17 (right) cells. (G) In vitro killing of NT2 tumor cells by 7/15 CAR T and Th/Tc17 CAR T cells after overnight culture. (H) Histogram flow plots of IL-17A, TNF, and IFN-γ secretion by Th/Tc17 CAR T and 7/15 CAR T compared with mock T cells after coculture with Neu+ cells at 3:1 ratio for 6 h. (I) Tumor area change was calculated and compared in FVB-neu mice that received Th/Tc17 CAR T cells or 7/15 CAR T cells. (J) Detection of CD4+ and CD8+ CAR T cells in spleen or tumor by flow cytometry 5 d after injection of 7/15 CAR T cells or Th/Tc17 CAR T cells. Data are shown as mean ± SD; *, P < 0.05; **, P < 0.01; significance was determined by Student’s t test or two-way ANOVA. n ≥ 5 mice per group with data from at least two independent experiments with the presented data pooled.

