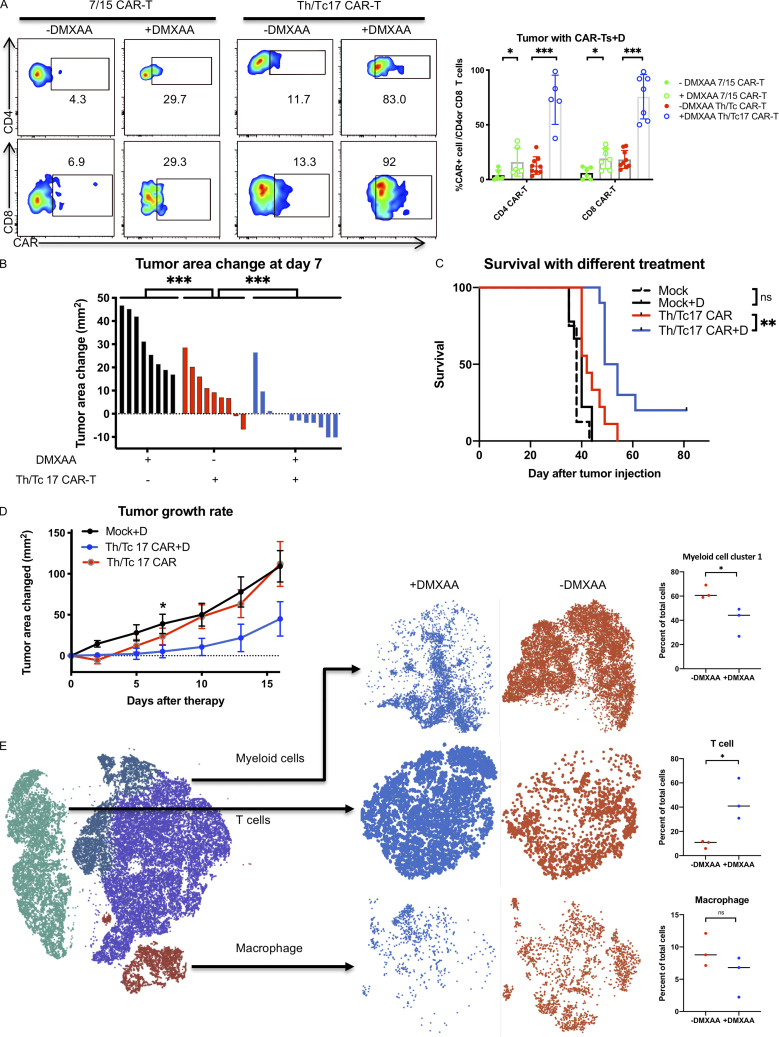
Figure 2.
Tumor control by Th/Tc17 CAR T cells is enhanced by DMXAA injection owing to altered composition of tumor infiltrating immune cells. NT2 tumors were orthotopically injected into murine mammary pads. 21 d later, 500 µg of DMXAA was injected at a site distal to the tumor site, followed by injection of 3 × 10⁶ mock T cells, 7/15 CAR T cells, or Th/Tc17 CAR T cells (CD4+:CD8+ at ∼1:1 ratio). (A) Representative flow cytometry histograms of CAR T detection in TME (left) and summary of accumulation of CAR T cells (right). (B) Change in tumor area was measured 7 d after treatment. (C) Kaplan–Meier survival curve for the treatment cohorts. End point criteria for sacrifice was a tumor area of ≥200 mm2. (D) Tumor area change 14 d after indicated therapy. (E) t-SNE analysis of pooled single-cell sequencing data generated from tumor-infiltrating CD45+ immune cells 7 d after receiving Th/Tc17 CAR T cells in the presence or absence of DMXAA. Data were analyzed by unsupervised clustering, and populations were determined by expression of key markers, including Cd3e (T cells), Adgre1 (macrophages), and Itgam and/or Itgax (myeloid cells). Right: Further classification of subpopulation between DMXAA-treated (+DMXAA) and non–DMXAA-treated (−DMXAA) mice and summary data comparing the frequency of indicated cell populations between +DMXAA and −DMXAA animals. Gating of flow cytometry data used fluorescence minus one controls for each individual experiment. Data are shown as mean ± SD; ns, not significant; *, P < 0.05; **, P < 0.01; ***, P < 0.001; significance was determined by Student’s t test or log-rank Mantel–Cox test when comparing survival. n ≥ 5 mice per group with data from at least two independent experiments (except for scRNA-seq), with the presented data pooled.

