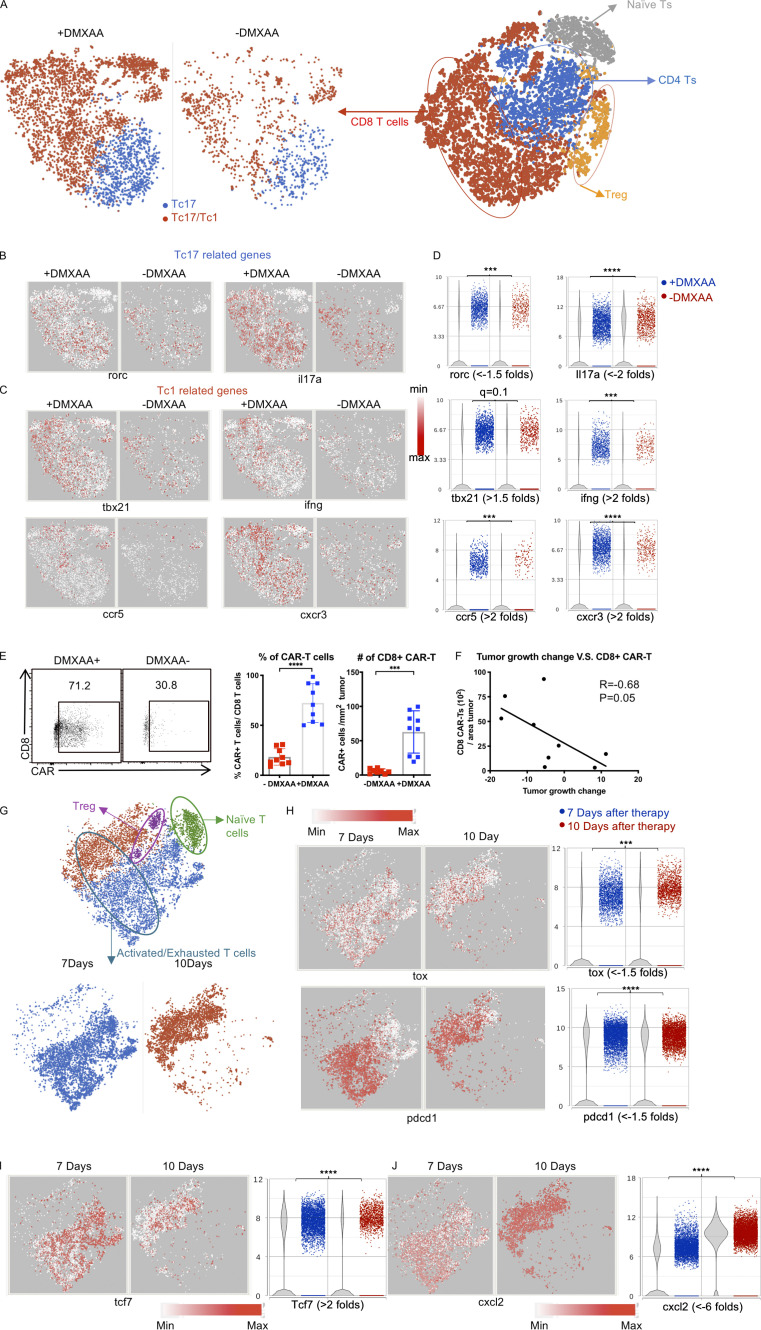
Figure 3.
DMXAA treatment enhances the number and cytotoxicity of Tc17 CAR T cells in the TME, although they eventually become exhausted. (A) T cell populations were subdivided based on expression of Cd8 and Cd44 (activated CD8 T cells), Cd44 (naive T cells), and Cd4 and Foxp3 (T reg cells). CD8+ T cells were compared between the +DMXAA and −DMXAA treatment groups, and each subpopulation was examined further as described below. (B) t-SNE plots of CD8+ T cells for Tc17-related genes. (C) t-SNE plots of CD8+ T cells for Tc1-related genes. (D) Violin plots depicting the distribution and change in expression of genes identified in B and C. (E) Validation of single-cell sequencing data using flow cytometry to detect CD8+ CAR T cells. Representative flow plots (left) and frequency (middle) and number (right) of CD8+ CAR T cells. (F) Analysis of the correlation between tumor growth and absolute cell number of CAR-expressing CD8+ T cells/cm2 tumor. (G) Activated or exhausted T cells were selected by unsupervised clustering result of tumor-infiltrating immune cells from 7 and 10 d after Th/Tc17 CAR+DMXAA therapy and shown as a t-SNE plot. (H) t-SNE plot (left) and violin plot (right) of T cells assessing genes associated with T cell exhaustion. (I) t-SNE plot (left) and violin plot (right) of T cells for genes associated with T cell effector function. (J) t-SNE plot (left) and violin plot (right) of T cells for genes associated with chemokine secretion. Data (excluding scRNA-seq) represent one of two independent experiments (n ≥ 5 mice per group). Single-cell sequencing data represent two to three mice/treatment group, and statistical significance was determined by differential GSA from Partek flow workstation. *, q < 0.05; **, q < 0.01; ***, q < 0.001; ****, q < 0.0001 in the change of gene expression level. Fold change is +DMXAA versus −DMXAA or 7 versus 10 d. For percentage/number change, please refer to Fig. S2 C. Flow-cytometric analysis was pooled from two independent experiments and is shown as mean ± SD. Statistical analysis for cytometric analysis was determined by Student’s t test; ***, P < 0.001; ****, P < 0.0001.

