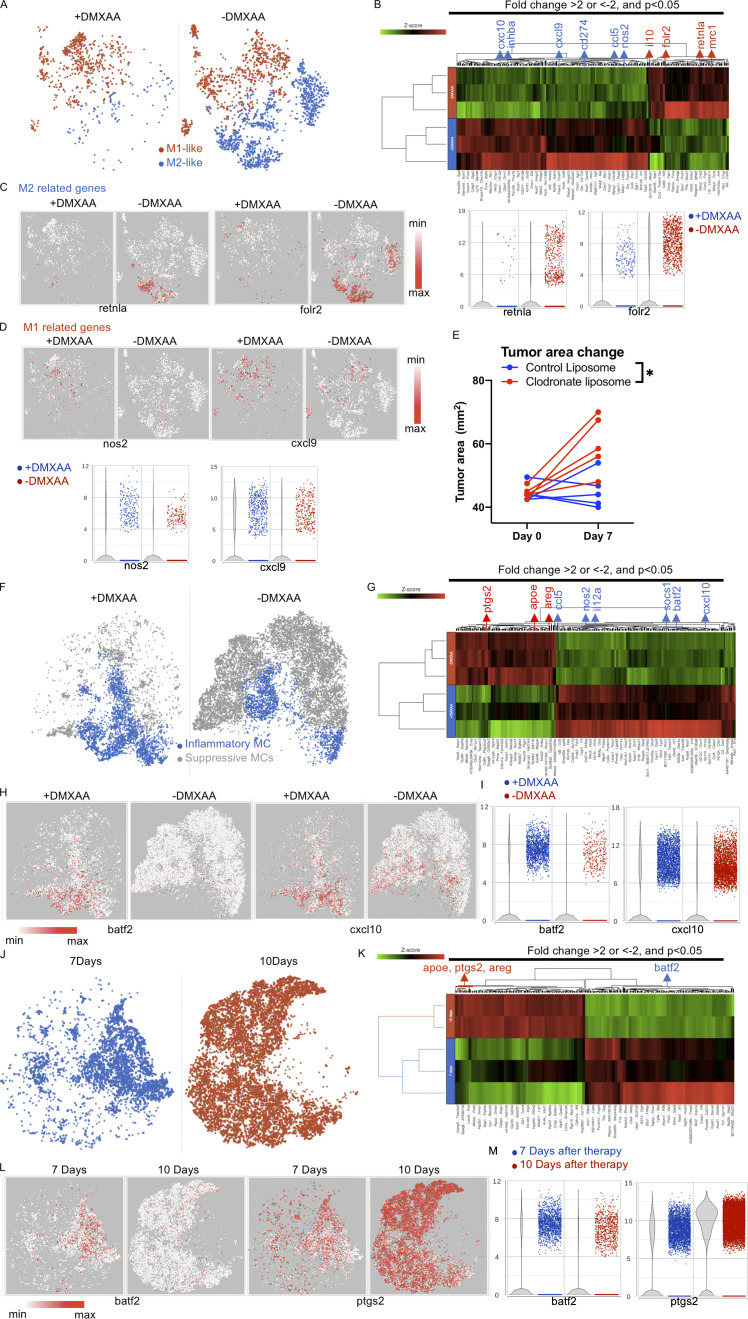
Figure 4.
DMXAA reduces the accumulation of suppressive macrophages and enhances the trafficking of T cells in the TME, but this effect is eventually lost due to the return of immunosuppressive cells. (A) t-SNE plot of macrophage populations identified by unsupervised clustering (Fig. 2), selected and classified as M1- or M2-like, and compared between mice receiving therapy with or without DMXAA treatment. (B) Heatmap of genes identified in A exhibiting a greater than twofold change in expression following DMXAA treatment, with a significant difference of P < 0.05 (determined by GSA). (C) t-SNE plot (left) and violin plots (right) showing expression of M2-related genes. (D) t-SNE plot (left) and violin plots (right) showing expression of M1-related genes. (E) Tumor area before and after 7 d of treatment with Th/Tc17 CAR T and DMXAA therapy after injection of clodronate or control liposomes. (F) t-SNE plot of myeloid populations identified by unsupervised clustering (Fig. 2), selected and classified as inflammatory myeloid cells or suppressive myeloid cells, and compared between mice in the presence or absence of DMXAA treatment. (G) Heatmap of genes identified in F exhibiting a greater than twofold change in expression following DMXAA treatment, with a significant difference of P < 0.05 (determined by GSA). (H) t-SNE plot depicting genes preferentially expressed in inflammatory myeloid cells. (I) Violin plots showing distribution and change in expression of genes highlighted in H. Myeloid cells from unsupervised clustering 7 and 10 d after therapy were selected. (J) t-SNE plot of myeloid cells between 7 and 10 d after therapy. (K) Heatmap of proinflammatory or suppressive genes that exhibited a greater than twofold change in expression following DMXAA treatment, with a significant difference of P < 0.05. (L) t-SNE plot of myeloid cells illustrating genes associated with the inflammatory and suppressive functions of myeloid cells. (M) Violin plots showing distribution and change of indicated gene expression in L. *, P < 0.05; significance was determined by Student’s t test. Single-cell sequencing data represent two to three mice/treatment group. Macrophage depletion assay was done independently twice with representative result shown.

