Figure S1.
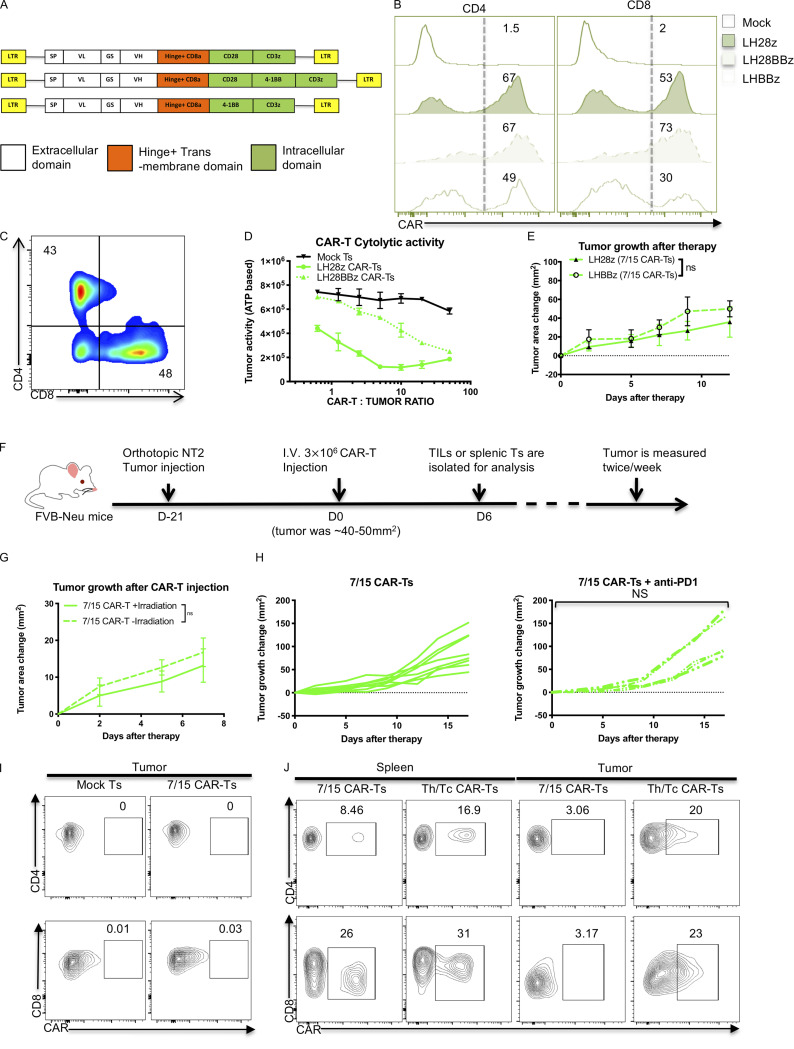
IL-7/15 cultured CAR T cells fail to control in vitro or in vivo tumor growth control compared with Th/Tc17 CAR T cells. (A) Schematic of the different CAR cassettes encoding the scFv (7.16.4), hinge and transmembrane domain from CD8 and intracellular domains from CD3ζ, 4-1BB, and/or CD28. (B) Expression of CAR T receptor on IL-7/15 cultured LH28BBz or LHBBz CAR T cells compared with LH28z CAR T cells. (C) Ratio of CD4+:CD8+ CAR T cells after 6 d of expansion with IL-7 and IL-15. (D) NT2 cells were cocultured with different ratios of indicated CAR T cells for 6 h, and tumor cell ATP activity was measured. Tumor ATP level indicating death of tumor cells was characterized at different ratios of mock T cells, LH28z, or LH28BBz CAR T cells. (E) Tumor area change was calculated following the administration of IL-7/15 cultured LHBBz or LH28z CAR T cells (3 × 10⁶ CAR T cells intravenously at 1:1 CD4+:CD8+ ratio) into tumor-bearing mice when the tumor size reached 50 mm2. (F) Schematic of the tumor model in which 5 × 10⁴ NT2 tumor cells were injected orthotopically into the mammary fat pad at day −21. Mice received 3 × 10⁶ CAR T cells intravenously at 1:1 CD4+:CD8+ ratio at day 0 when the tumor size reached 50 mm2. (G) Tumor area change was calculated following injection of 7/15 CAR T before lymphopenia induced by 5 Gy total body irradiation. (H) Tumor area change was calculated following the administration of anti–PD-1 (200 µg/mouse) twice a week following 7/15 CAR T injection. (I) Representative flow cytometry histograms show detection of CAR T cells within the tumor 5 d after 7/15 CAR T infusion. (J) Representative flow plots showing detection of CAR T cells within the tumor or spleen 5 d after 7/15 CAR T or Th/Tc17 CAR T infusion. Data are shown as mean ± SD; ns, not significant; significance was determined by Student’s t test or two-way ANOVA. Mouse studies used a minimum of five mice per group and represent at least two independent experiments. Data were shown as either representative batch or pooled.

