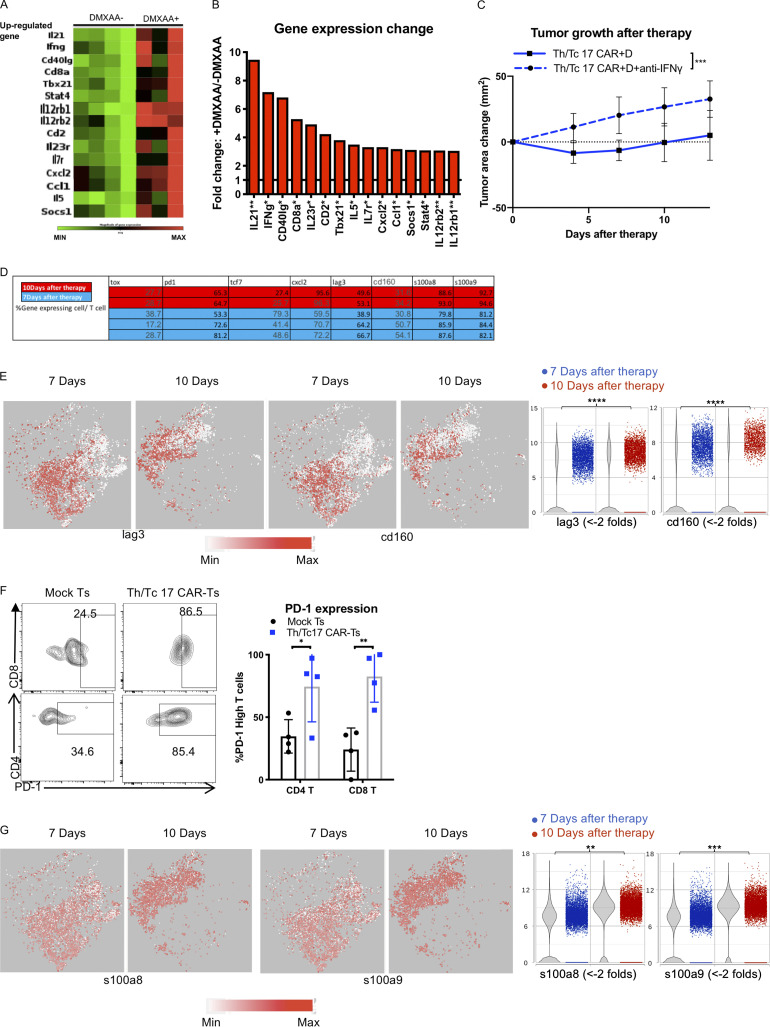
Figure S3.
DMXAA treatment enhances IFN-γ–dependent antitumor function of Th/Tc17 CAR T cells, but T cell exhaustion limits the cumulative beneficial effect of DMXAA on Th/Tc17 CAR T therapy. Mice received Th/Tc17 CAR T cells in the presence or absence of DMXAA therapy. 7 d later, RNA from tumors was isolated and analyzed by microarray for Th17/Th1 response. (A) Heatmap depicts genes where fold-change was significant, with a threefold increase. Each column represents an individual mouse. (B) Quantification of significant changes (P < 0.05) in TME for Th17 or Th1 response following DMXAA treatment. (C) Mice were treated i.p. with anti–IFN-γ (250 µg/mouse) twice a week after Th/Tc17 CAR T therapy. Significance was determined by Student’s t test or two-way ANOVA. Studies involved at least four mice per independent experiment. Data from C represent two independent experiments with four mice per group. (D–G) T cell cluster selected based on expression of Cd3e by unsupervised clustering of tumor-infiltrating immune cells from 7 and 10 d after Th/Tc17 CAR + D therapy. (D) Table shows the percentage of T cells expressing the indicated genes calculated from scRNA-seq data. (E) t-SNE plot (left) and violin plot (right) of T cells for genes associated with T cell exhaustion. (F) Validation of PD-1 expression using flow-based method to detect high levels of PD-1 expression on T cells from mice receiving Th/Tc17 CAR T or mock T cell therapy. Representative flow cytometry histograms (left); percentage of CAR T (right) within the CD4 or CD8 T cell group (n = 4/group). (G) t-SNE plot (left) and violin plot (right) of T cells for genes associated with T cell apoptosis. Data (excluding scRNA-seq) represent one of two independent experiments (n ≥ 5 mice per group). Single-cell sequencing data represent two to three mice/treatment group. Statistical significance was determined by differential GSA with the Partek flow workstation. *, q < 0.05; **, q < 0.01; ***, q < 0.001; ****, q < 0.0001 in the change of gene expression level. Fold change is 7 versus 10 d. For percentage/number change, please refer to Fig. S3 D. Flow cytometric analysis is shown as mean ± SD. Statistics analysis for cytometric analysis was determined by Student’s t test; *, P < 0.05; **, P < 0.01; ***, P < 0.001; ****, P < 0.0001.

