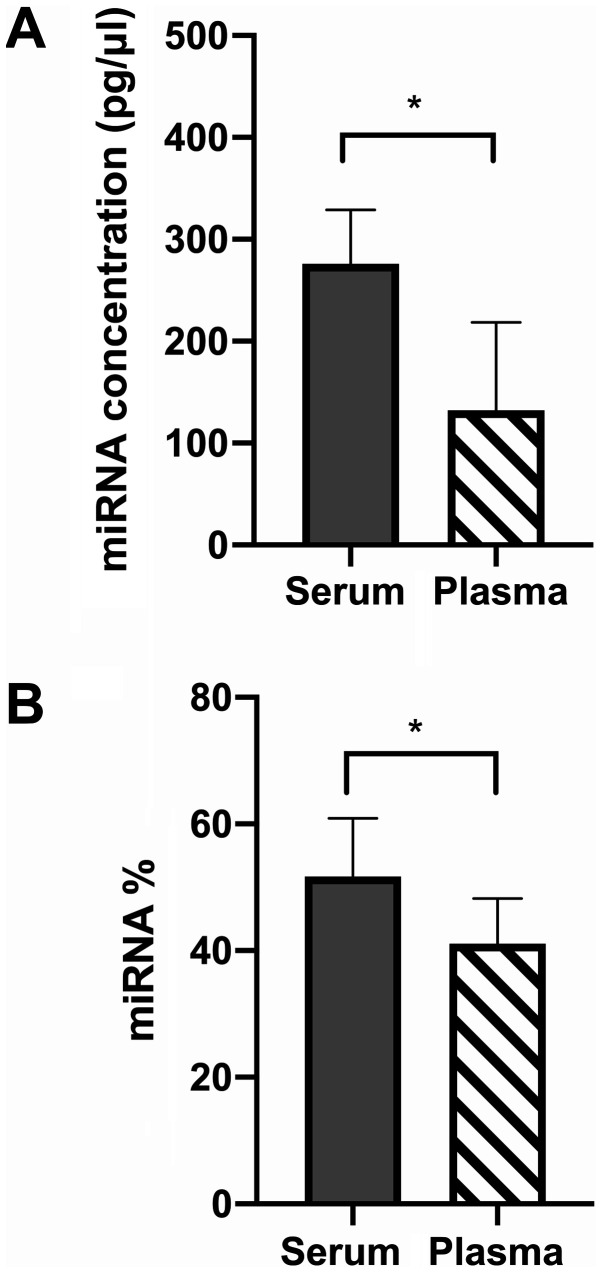
Figure 1.
Bioanalyzer data. (A) miRNA concentration as the median + 95% confidence interval of the serum vs. plasma samples measured using the Agilent Bioanalyzer Small RNA chip. n=20. Wilcoxon matched pairs signed rank test, P=0.0039. A Shapiro-Wilk test of normality was passed for plasma (W=0.95, P=0.65) but not for serum (W=0.65, P=0.0002). (B) MiRNA percentage as the mean + standard deviation of serum vs. plasma samples measured using the Agilent Bioanalyzer Small RNA chip. n=20. A two-tailed paired t-test was used to compare data (t=4.97, P=0.0008, df=9). Shapiro-Wilk test of normality was passed for both plasma and serum (plasma W=0.97, P=0.84; serum W=0.95, P=0.67). *P<0.05. miRNA, microRNA.

