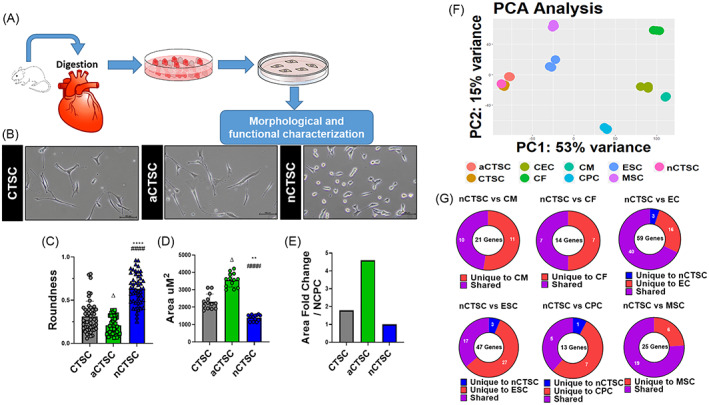
FIGURE 1.

RNA‐sequencing identifies CTSCs in the heart. A, Illustration describes isolation strategy for CTSCs based upon digestion of whole heart from 2‐day‐old, 2‐month‐old, and 2‐year‐old mice followed by plating in growth medium. At day 1 postplating, adherent cells were discarded, and supernatant was replated and the cell were grown for 2 to 3 weeks that led to emergence of CTSCs followed by analysis molecular and functional analyses. B, Morphological analysis of the CTSC populations isolated from 2‐day‐old (nCTSC), 2‐month‐old (CTSC), and 2‐year‐old (aCTSC) mice. C, Roundness, D, cell area, and, E, Area fold change was calculated using ImageJ. Scale bar = 100 μm. n = 20 number of cell counted/three independent experiments for all three cell lines. F, Principal component analysis details clustering of biological replicates of the same condition between CTSCs population from different ages and other cardiac cell and stem cells types (n = 3 replicates/cell lines used for RNA sequencing). G, Comparison of CTSC transcriptome to putative markers for CMs, CFs, ECs, ESCs, MSCs, and CPCs using R&D systems database. nCTSC vs CTSCs *P < .05, **P < .01, ***P < .001, nCTSC vs aCTSC # P < .05, ## P < .01, ### P < .001, and nCTSC vs aCTSCs Δ P < .05, ΔΔ P < .01, ΔΔΔ P < .001. See also Figures S1 and S2, and Tables S2 and S3. CFs, cardiac fibroblasts; CMs, cardiomyocytes; CPCs, cardiac progenitor cells; CTSCs, cardiac tissue derived stem‐like cells; ECs, endothelial cells; MSCs, mesenchymal stem cells
