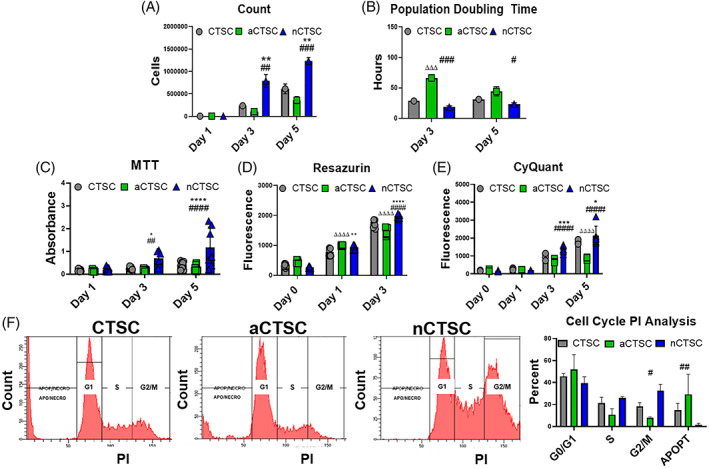
FIGURE 2.

Increased viability, metabolic activity, and proliferation rate in nCTSC compared to other CTSC populations. A, Viability cell counts show increased cell number in nCTSCs compared to CTSC and aCTSC over the course of 5 days in culture (n = 6). B, Decreased population doubling time in nCTSC compared to CTSCs and aCTSC (n = 6). C, Increased metabolic activity in nCTSC compared to CTSCs and aCTSC at day 3 and 5 after culture as measured by MTT assay (n = 5) as well as Resazurin assay (n = 5) in (D). E, nCTSC exhibit increased cell proliferation at day 3 and day 5 compared to CTSCs and aCTSC as assessed by CyQuant assay (n = 5). F, Flow cytometry‐based measurement of cell cycle shows decreased percentage of cells in G1 and a corresponding increase in percentage of cells in S/G2 phases in nCTSC compared to CTSC and aCTSC (n = 3). nCTSC vs CTSCs *P < .05, **P < .01, ***P < .001, nCTSC vs aCTSC # P < .05, ## P < .01, ### P < .001, and nCTSC vs aCTSCs Δ P < .05, ΔΔ P < .01, ΔΔΔ P < .001. See also Figures S3 and S4. CTSCs, cardiac tissue derived stem‐like cells
