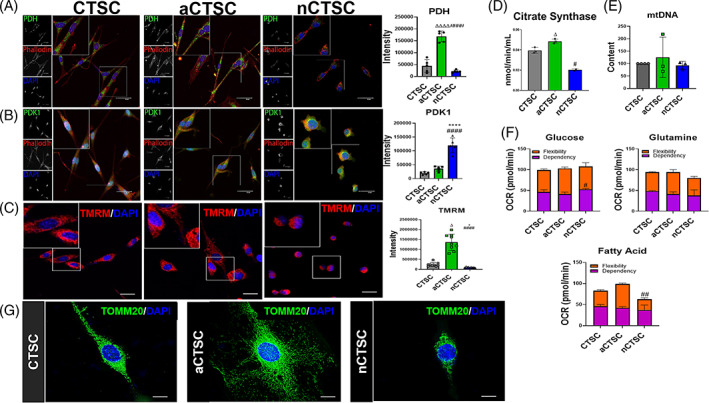
FIGURE 5.

Decreased mitochondrial respiration in nCTSCs that alters with age. A, Decreased expression of PDH in nCTSC while aCTSC exhibit the highest PDH expression compared to CTSCs along with quantification. B, nCTSC show increased expression of PDK1 while aCTSC have the lowest as compared to CTSCs along with quantification. PDH/PDK1 (green), Phalloidin (red), nuclei (blue). Scale bar = 20 μm. C, Citrate synthase activity assay shows decreased activity in nCTSCs while highest in aCTSC as compared to CTSCs. D, Decreased mtDNA in nCTSC while aCTSC have the highest compared to CTSCs as measured by mtDNA content assessment (n = 4). E, nCTSC demonstrate low mitochondrial membrane potential visualized by TMRM staining while aCTSC have the highest TMRM intensity. TMRM (red), nuclei (blue), Scale bar = 20 μm (n = 4). F, Substrate flexibility, capacity, and dependence measurements in CTSCs using fuel flex assay (n = 6 replicates/line/three independent experiments). G, Unique mitochondrial morphology in three CTSC types analyzed for TOMM20 (green), nuclei (DAPI). Scale bar = 10 μm. nCTSC vs CTSCs *P < .05, **P < .01, ***P < .001, nCTSC vs aCTSC # P < .05, ## P < .01, ### P < .001, and nCTSC vs aCTSCs Δ P < .05, ΔΔ P < .01, ΔΔΔ P < .001. CTSCs, cardiac tissue derived stem‐like cells; DAPI, 4′,6‐diamidino‐2‐phenylindole; PDH, pyruvate dehydrogenase; TMRM, tetramethylrhodamine, methyl ester, perchlorate
