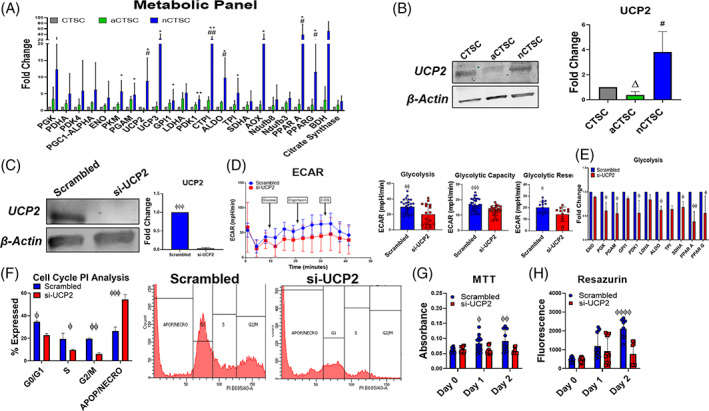
FIGURE 6.

Identification of UCP2 as a regulator of nCTSC metabolic function and proliferation. A, Assessment of metabolic genes in CTSCs populations by qRT‐PCR analysis (n = 4). B, Increased expression of UCP2 expression in nCTSC while aCTSC have the lowest expression compared to CTSCs as confirmed by immunoblot (n = 4). C, Validation of UCP2 knockdown by siRNA in nCTSC compared to scrambled treated nCTSC by immunoblot (n = 4). D, Reduced ECAR, glycolysis, glycolytic capacity, and glycolytic reserve in siRNA treated nCTSC compared to scrambled controls as measured by seahorse assay (n = 4 replicates/line/three independent experiments). E, Reduced expression of glycolytic genes and enzymes in si‐UCP2 nCTSC compared to scrambled nCTSC as measured by qRT‐PCR analysis (n = 4). F, Flow cytometry cell cycle assessment shows increased apoptosis and reduced cell cycle activity in si‐UCP2 treated nCTSC compared to control nCTSC (n = 4). nCTSC vs siUCP2‐nCTSC *P < .05, **P < .01, ***P < .001. CTSCs, cardiac tissue derived stem‐like cells; ECAR, extracellular acidification rate; qRT‐PCR, quantitative real time polymerase chain reaction; siRNA, small interfering RNA; UCP2, uncoupling protein 2
