FIGURE 7.

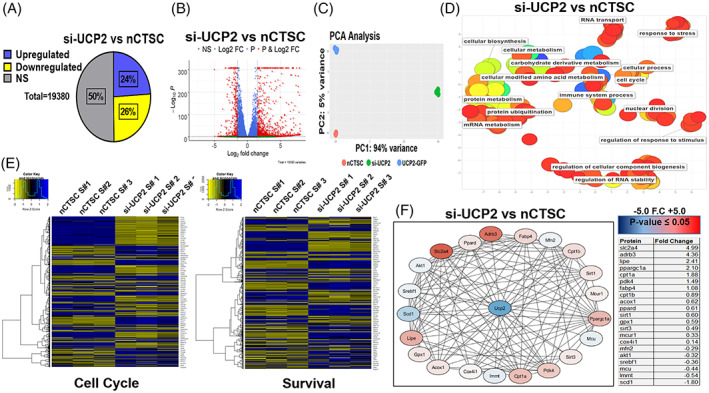
UCP2 silencing impairs nCTSC proliferation, survival, and metabolic signaling. A, Bulk‐RNA sequencing identifies significantly upregulated and downregulated genes in nCTSC after UCP2 silencing. B, Volcano plot representation of siUCP2 treated nCTSC compared to control nCTSC. C, Principal component analysis defines variance between nCTSCs and si‐UCP2‐nCTSCs and clusters biological replicates of the same condition while nCTSC overexpressing UCP2 were employed as a positive control condition. D, REVIGO analysis details significant GO terms clustered together. Color of each dot (GO Term) is the log10 (P value) generated from the GO analysis with blue as low and red as high. Size of the the dot is based on the frequency of the GO term. Broad based GO terms will have a larger dot size. E, Cell signaling pathways for cell cycle and survival are significantly altered between siUCP2‐nCTSC compared to nCTSC. F, Protein‐protein interactions analyzed by STRING software and visualized through Cytoscape shows the most highly upregulated, downregulated proteins in relation to UCP2 after knockdown in nCTSC. See also Figure S6 and Tables S7 and S8. CTSCs, cardiac tissue derived stem‐like cells; GO, gene ontology; UCP2, uncoupling protein 2
