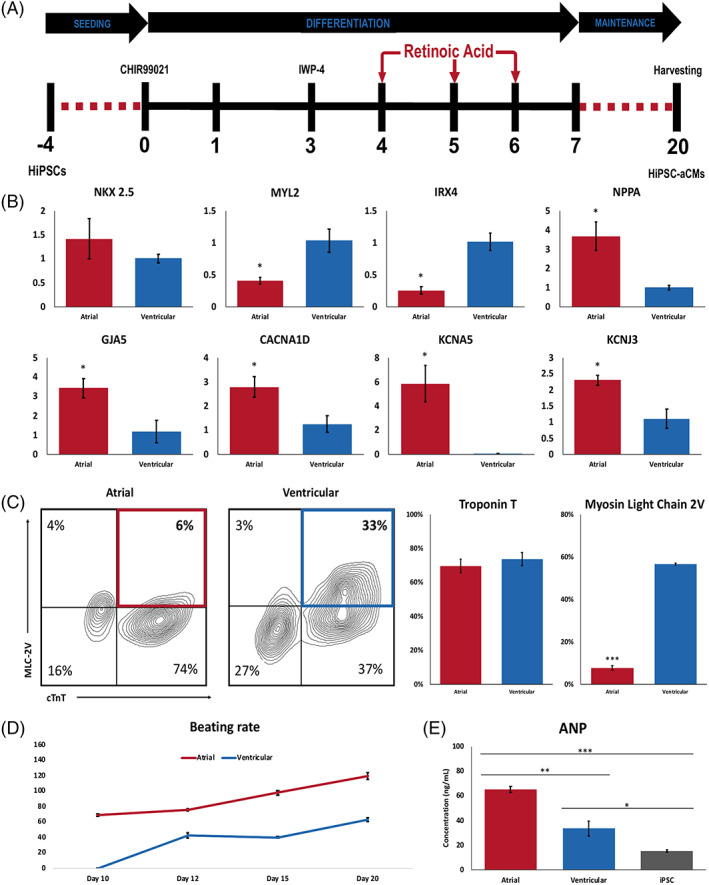
FIGURE 1.

Directed differentiation of hiPSC‐derived atrial and ventricular CMs. A, Schematic depicting the atrial differentiation protocol. Doses of 0.75 μM retinoic acid (RA) were added to the cells every 24 hours on days 4, 5, and 6 with media exchanged to RPMI1640 + B27 with insulin at day 7. Cells were harvested for analysis at day 20. B, qPCR analysis of ventricular markers MYL2 and IRX4, cardiac marker NKX2.5, and atrial markers NPPA, GJA5, CACNA1D, KCNA5, and KCNJ3. n = 3, unpaired t test, *P < .05. C, Flow cytometric analysis of cardiac troponin T (cTnT) and myosin light chain 2v (normalized to cTnT expression) in hiPSC‐aCMs and ‐vCMs. n = 4, unpaired t test, ***P < .001. D, Average beating rates of hiPSC‐aCMs and ‐vCMs from the day they begin to beat until day 20. n = 4 independent differentiation batches. E, Atrial Natriuretic peptide (ANP) concentration between hiPSCs, and hiPSC‐aCMs and ‐vCMs determined by competitive ELISA. n = 3 and n = 2 hiPSC lines, unpaired t test *P < .05, **P < .01, ***P < .001. Data are presented as mean ± SEM; One n represents one independent differentiation batch
