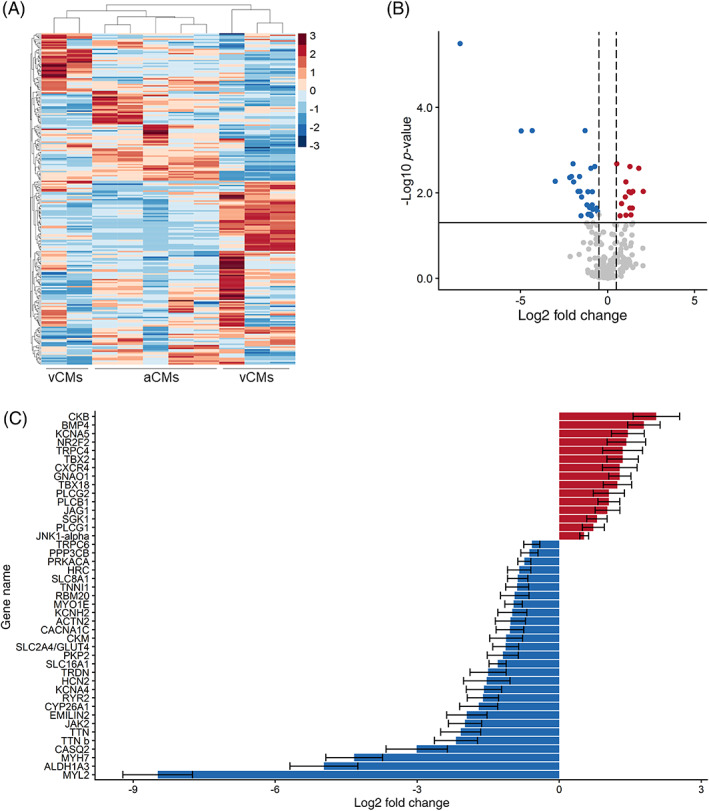
FIGURE 2.

Gene expression analysis of hiPSC‐aCMs and ‐vCMs using NanoString. Global gene expression pattern of hiPSC‐aCMs and ‐vCMs shown in A, heat map of the expression of the 250 genes across samples of hiPSC‐aCMs and ‐vCMs. The cluster dendrogram shows the unsupervised hierarchical clustering that was conducted using the agglomerative algorithm and the Euclidian distance criterion. B, Differentially expressed genes between hiPSC‐aCMs and ‐vCMs expressed in volcano plot shows 14 upregulated (red) and 27 downregulated (blue) genes in hiPSC‐aCMs. Solid horizontal line represents the Benjamini‐Hochberg false discovery rate (FDR) adjusted P‐value <.05 (−log10 = 1.3). Dashed vertical lines represent the arbitrary log2 fold change cut‐off of −0.5 and 0.5. C, Forty‐two differentially expressed genes identified from the statistical criteria of FDR adjusted P‐value <.05 and log2 fold change of <−0.5 and >0.5. Data are presented as mean ± SEM. n = 5 independent differentiation batches
