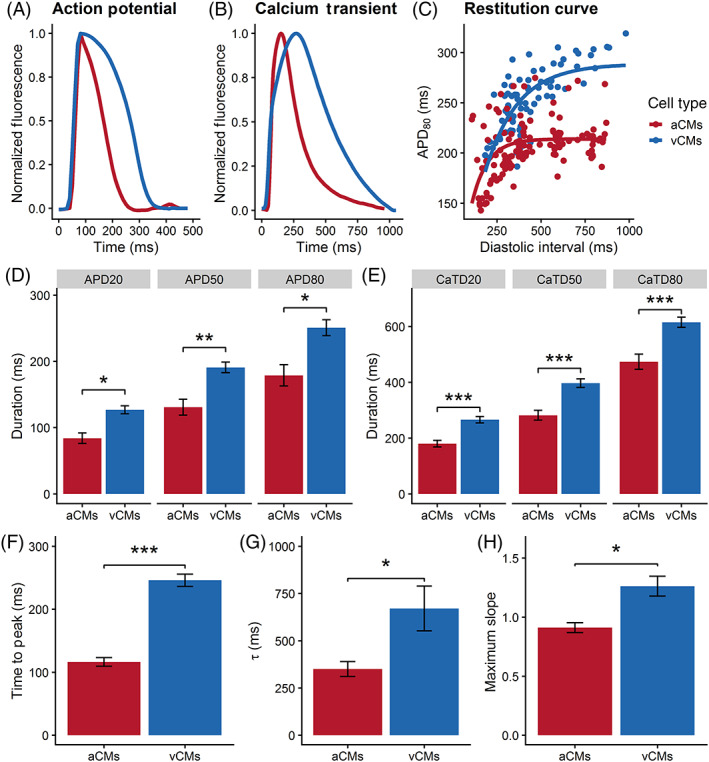
FIGURE 4.

Functional phenotyping of hiPSC‐derived atrial and ventricular CMs using optical mapping. Representative average traces of A, action potential and B, Ca2+ transients of hiPSC‐aCMs and ‐vCMs electrically paced at 1 Hz. C, Electrical restitution curve measured at APD80 relative to the diastolic interval (DI). D, Quantification of early‐ (APD20), mid‐ (APD50), and late‐ (APD80) repolarization, unpaired t test, *P < .05, **P < .01. E, Quantification of early‐ (CaTD20), mid‐ (CaTD50), and late‐ (CaTD80) Ca2+ transient decay, unpaired t test, ***P < .001. F, Time to peak (TTP) of the Ca2+ transient, unpaired t test, ***P < .001. G, Time constant (τ) of Ca2+ decay, unpaired t test *P < .05. H, Maximum slope of the electrical restitution as shown in panel C, unpaired t test, *P < .05. Electrical restitution curves were measured under a variable rate pacing protocol (60‐200 bpm) as described in the Supplemental Information. n = 4 (four independent differentiation batches) and cardiac enriched hiPSC‐aCMs and ‐vCMs were analyzed in these set of experiments. Data are presented as mean ± SEM
