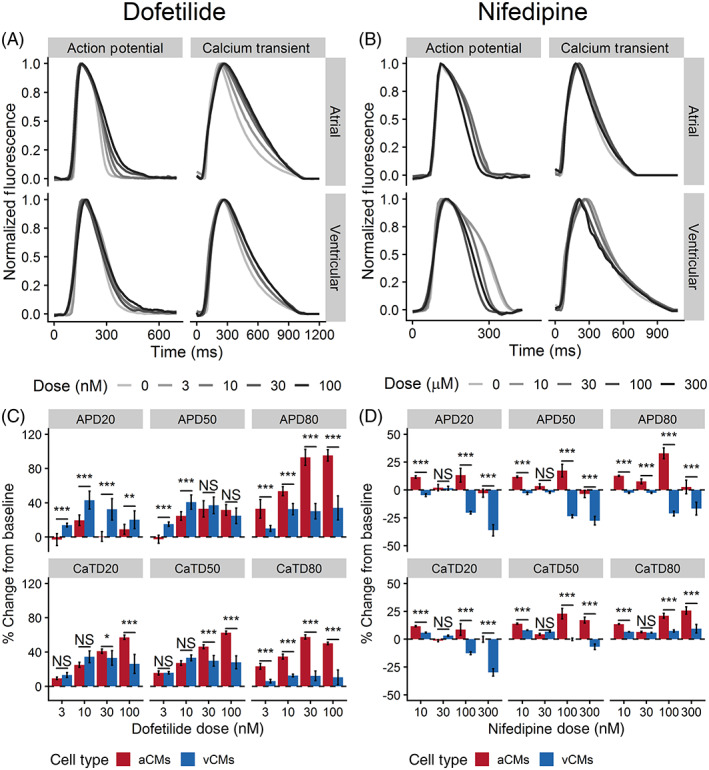
FIGURE 5.

The effects of dofetilide and nifedipine on action potential and Ca2+ transient of hiPSC‐aCMs and ‐vCMs. Representative traces of action potential and Ca2+ transients illustrating the effects of A, dofetilide and B, nifedipine on hiPSC‐aCMs and ‐vCMs. Higher drug doses are presented by a progressively darker shade. The effects of C, 4‐aminopyridine and D, nifedipine on normalized (percent change from predrug baseline) action potential duration (APD) and Ca2+ transient duration (CaTD); both parameters being measured at 20%, 50%, and 80%. Dashed line is the normalized predrug control presented as 0% change. n = 6 from six independent differentiation batches. hiPSC‐derived atrial cardiomyocytes (aCMs) are shown in red while hiPSC‐derived ventricular cardiomyocytes (vCMs) are presented in blue. Data are presented as mean ± SEM. Drug effects were compared between hiPSC‐aCMs and ‐vCMs at each dose using unpaired t test, *P < .05, **P < .001, ***P < .001. NS stands for not significant
