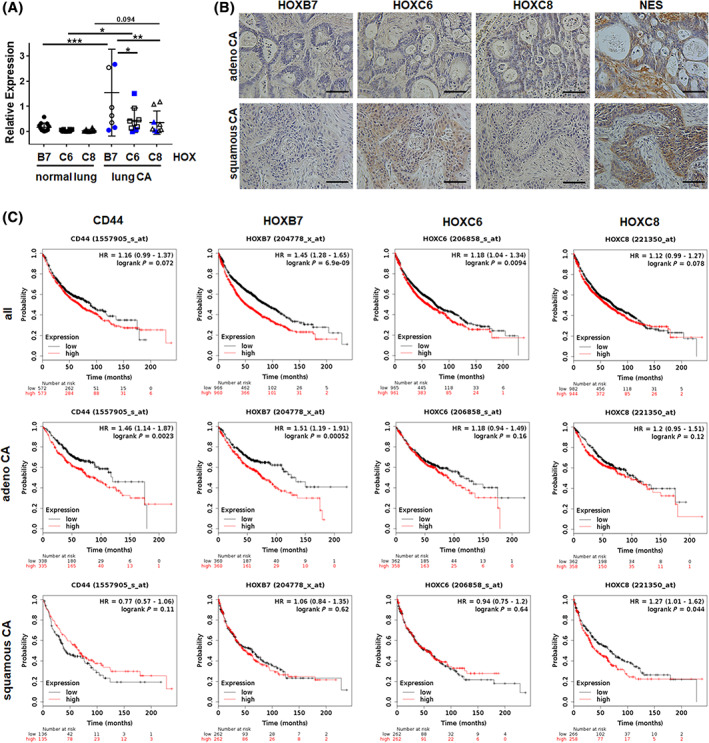
FIGURE 5.

Expression levels of the VW‐MSC‐specific “HOX code” in human NCSLC tissues and the prognostic impact. A, HOXB7, HOXC6, and HOXC8 mRNA expression levels were analyzed in total RNA isolates generated from normal lung or lung carcinoma (CA) tissue using qRT‐PCR. Data are presented as mean ± SEM (normal lung tissue: n = 12 per gene; NSCLC/lung CA: n = 9 per gene). Blue symbols depict squamous CA values. P‐values were indicated: *P ≤ .05, **P < .01, ***P ≤ .005 by one‐way ANOVA followed by post hoc Tukey's multiple comparisons test. B, Paraffin‐sections of human NSCLC specimen were stained for the indicated HOX antibodies in combination with DAB. Sections were counterstained using hematoxylin. Representative images are shown. Magnification ×20 (phase contrast), scale bar: 40 μm. C, Survival curves were plotted for all NSCLC patients (CD44: n = 1145; HOX: n = 1926) (left panel), adenocarcinoma (adenoCA) patients (CD44: n = 673; HOX: n = 720) (middle panel), and squamous cell carcinoma (squamous CA) patients (CD44: n = 271; HOX: n = 524) (right panel). Data was analyzed using Kaplan‐Meier plotter for lung cancer (www.kmplot.com). Expressions in cancer tissues above the median are indicated in red line, and expressions below the median in are summarized in black line. HR, hazard ratio
