
Fig. 4.
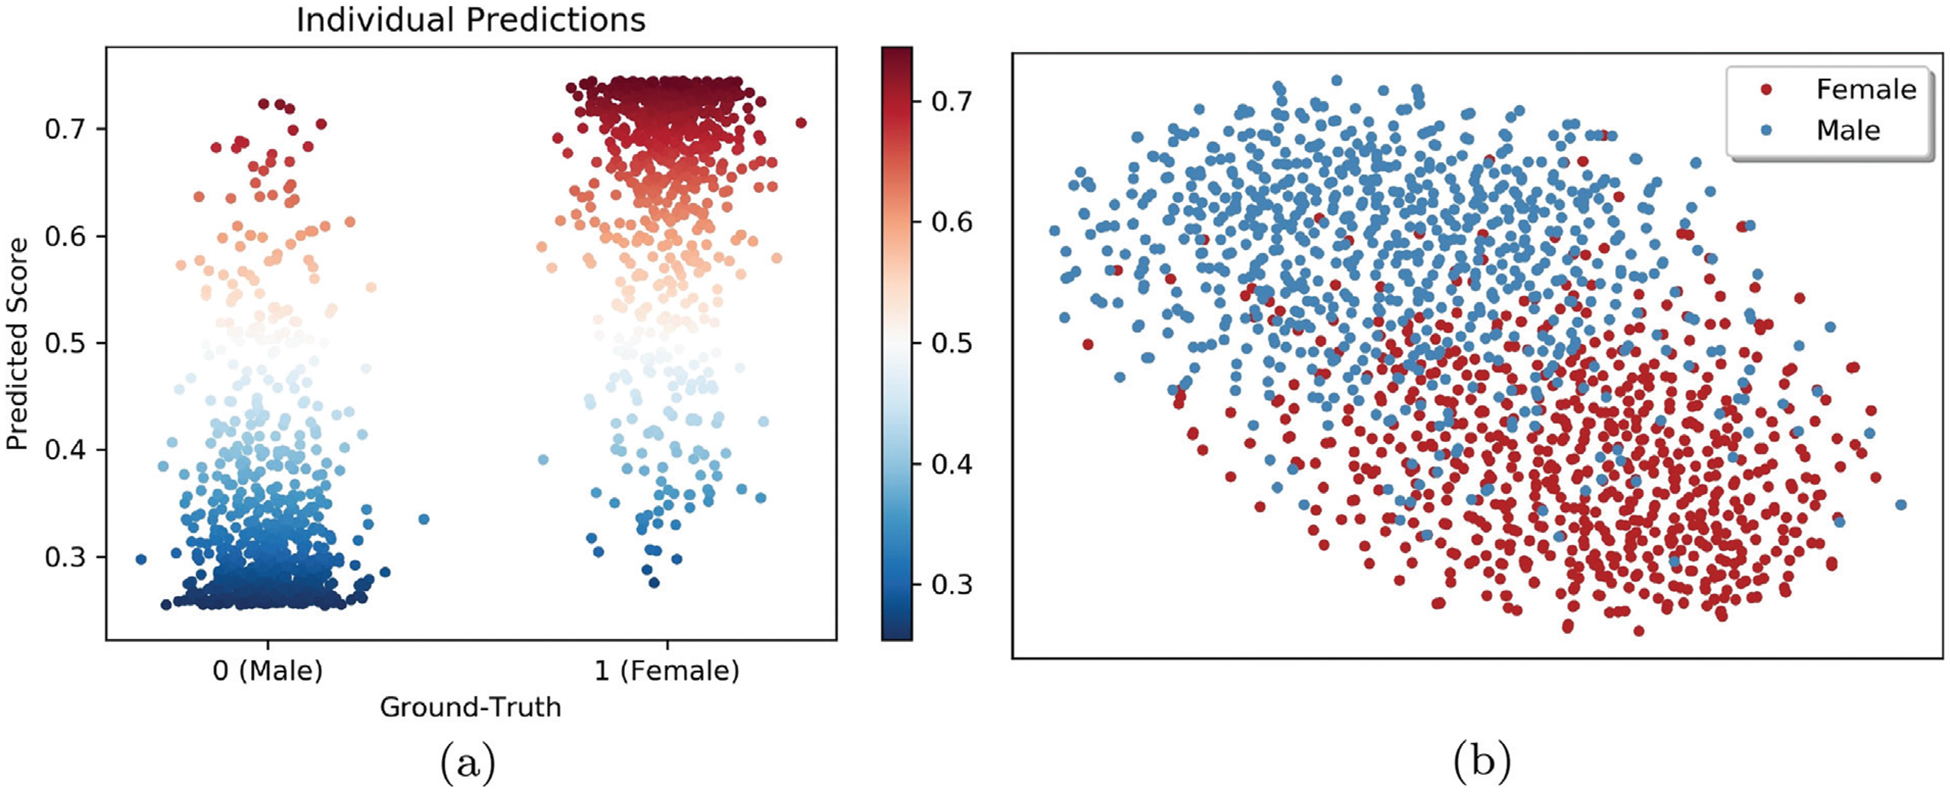
Visualization of Predictors and the Prediction Score as determined by the deep learning model. (a) Prediction Score (S) of each participant as a function of their observed sex. These two figures show that our deep learning model can effectively reduce the MRIs to a vector of predictors (P) and then to a scalar value (S) that distinguishes girls from boys. (b) t-Distributed Stochastic Neighbor Embedding (tSNE) (Maaten and Hinton, 2008) projection of extracted Predictors (P) in 2D space. Each point indicates one adolescent; color represents sex. The axes show the relative location of each individual with respect to their neighbors in 2D with neighborhoods reflecting those of the high dimensional space (according to Maaten and Hinton, 2008).