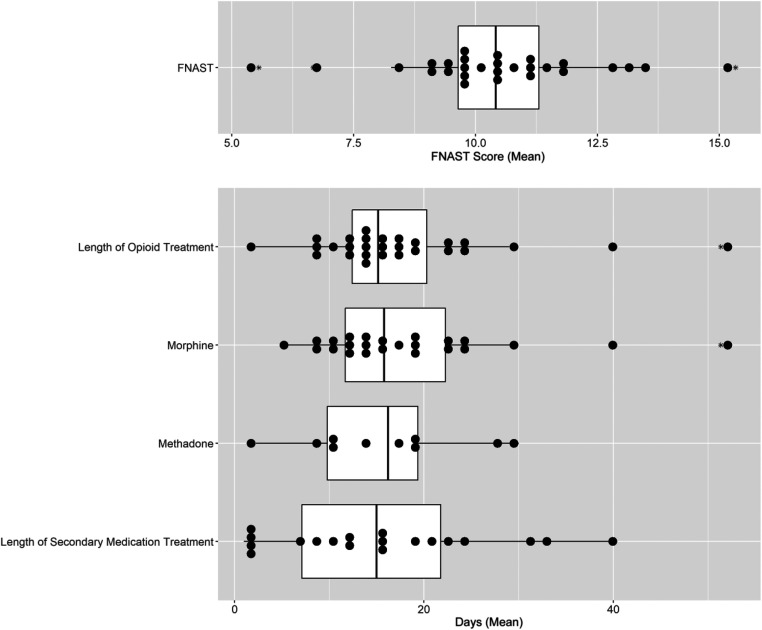
FIGURE 3.
Site-level variation in the initiation and length of pharmacologic therapy. The box plots consist of the 25th (quartile 1), 50th (median), and 75th (quartile 3) percentiles. The length of the whiskers represents the minimum (quartile 1 – 1.5 × IQR) and maximum (quartile 3 + 1.5 × IQR), where IQR = quartile 3 – quartile 1 (IQR). Each dot represents a single site mean and the asterisk denotes outliers.

