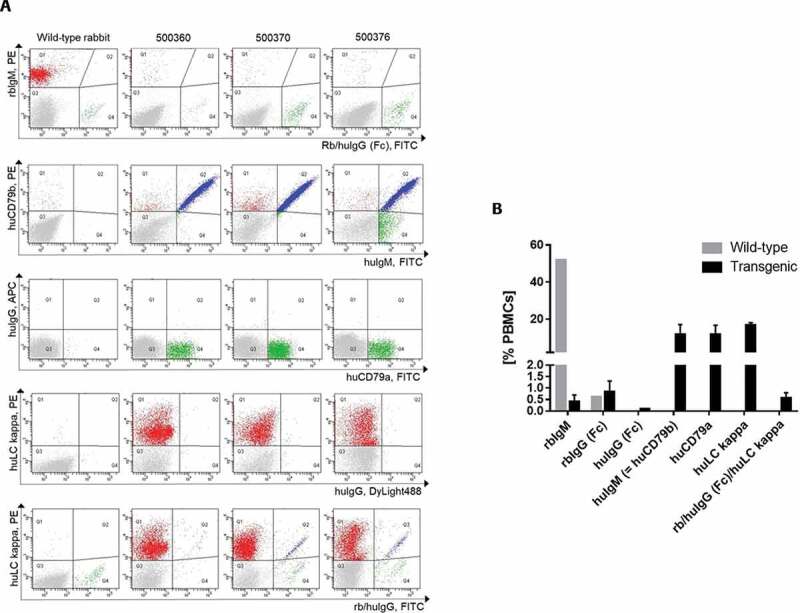
Figure 2.

(a) Characterization of the peripheral B-cell compartment of wild-type and transgenic rabbits using FACS analyses. FACS dot plots per column show representative profiles of peripheral blood mononuclear cells (PBMCs) of one wild-type rabbit and three transgenic rabbits (500350, 500370, 500376). The FACS dot plots in each row represent five different FACS double staining of live PBMCs using the cell-surface markers indicated. (b) Frequencies of different B-cell populations. The B cell frequency is measured as percentage of the count of gated cell-surface marker X-positive B cells of all PBMCs
