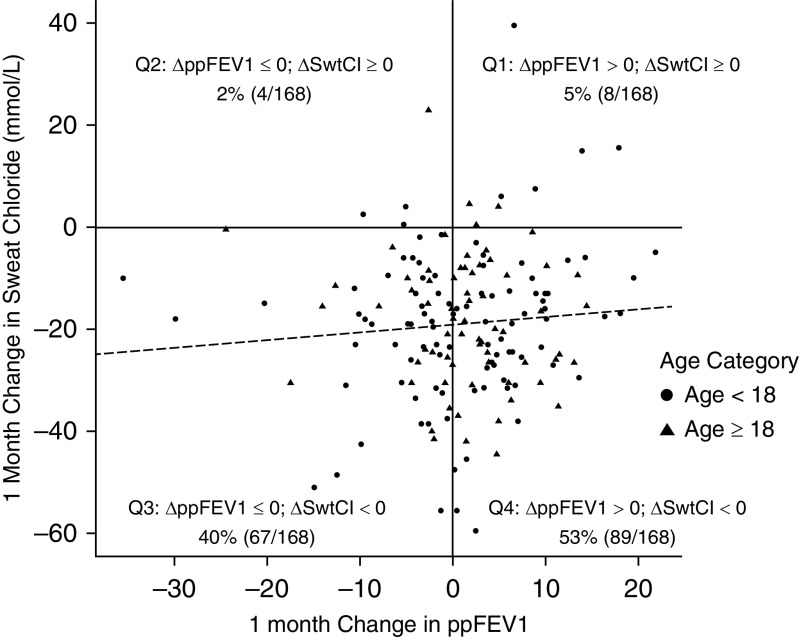
Figure 4.
One-month change in percent-predicted forced expiratory volume in 1 second (ppFEV1) versus 1-month change in sweat chloride (SwtCl; mmol/L). The gray dashed line represents the following model fit: 1-month change in sweat chloride, ∼ 1-month change ppFEV1 + age category. The 1-month change in SwtCl (i.e., slope estimate) corresponding to a 1% increase in ppFEV1 was +0.15 (95% confidence interval, −0.13 to 0.42) mmol/L.

