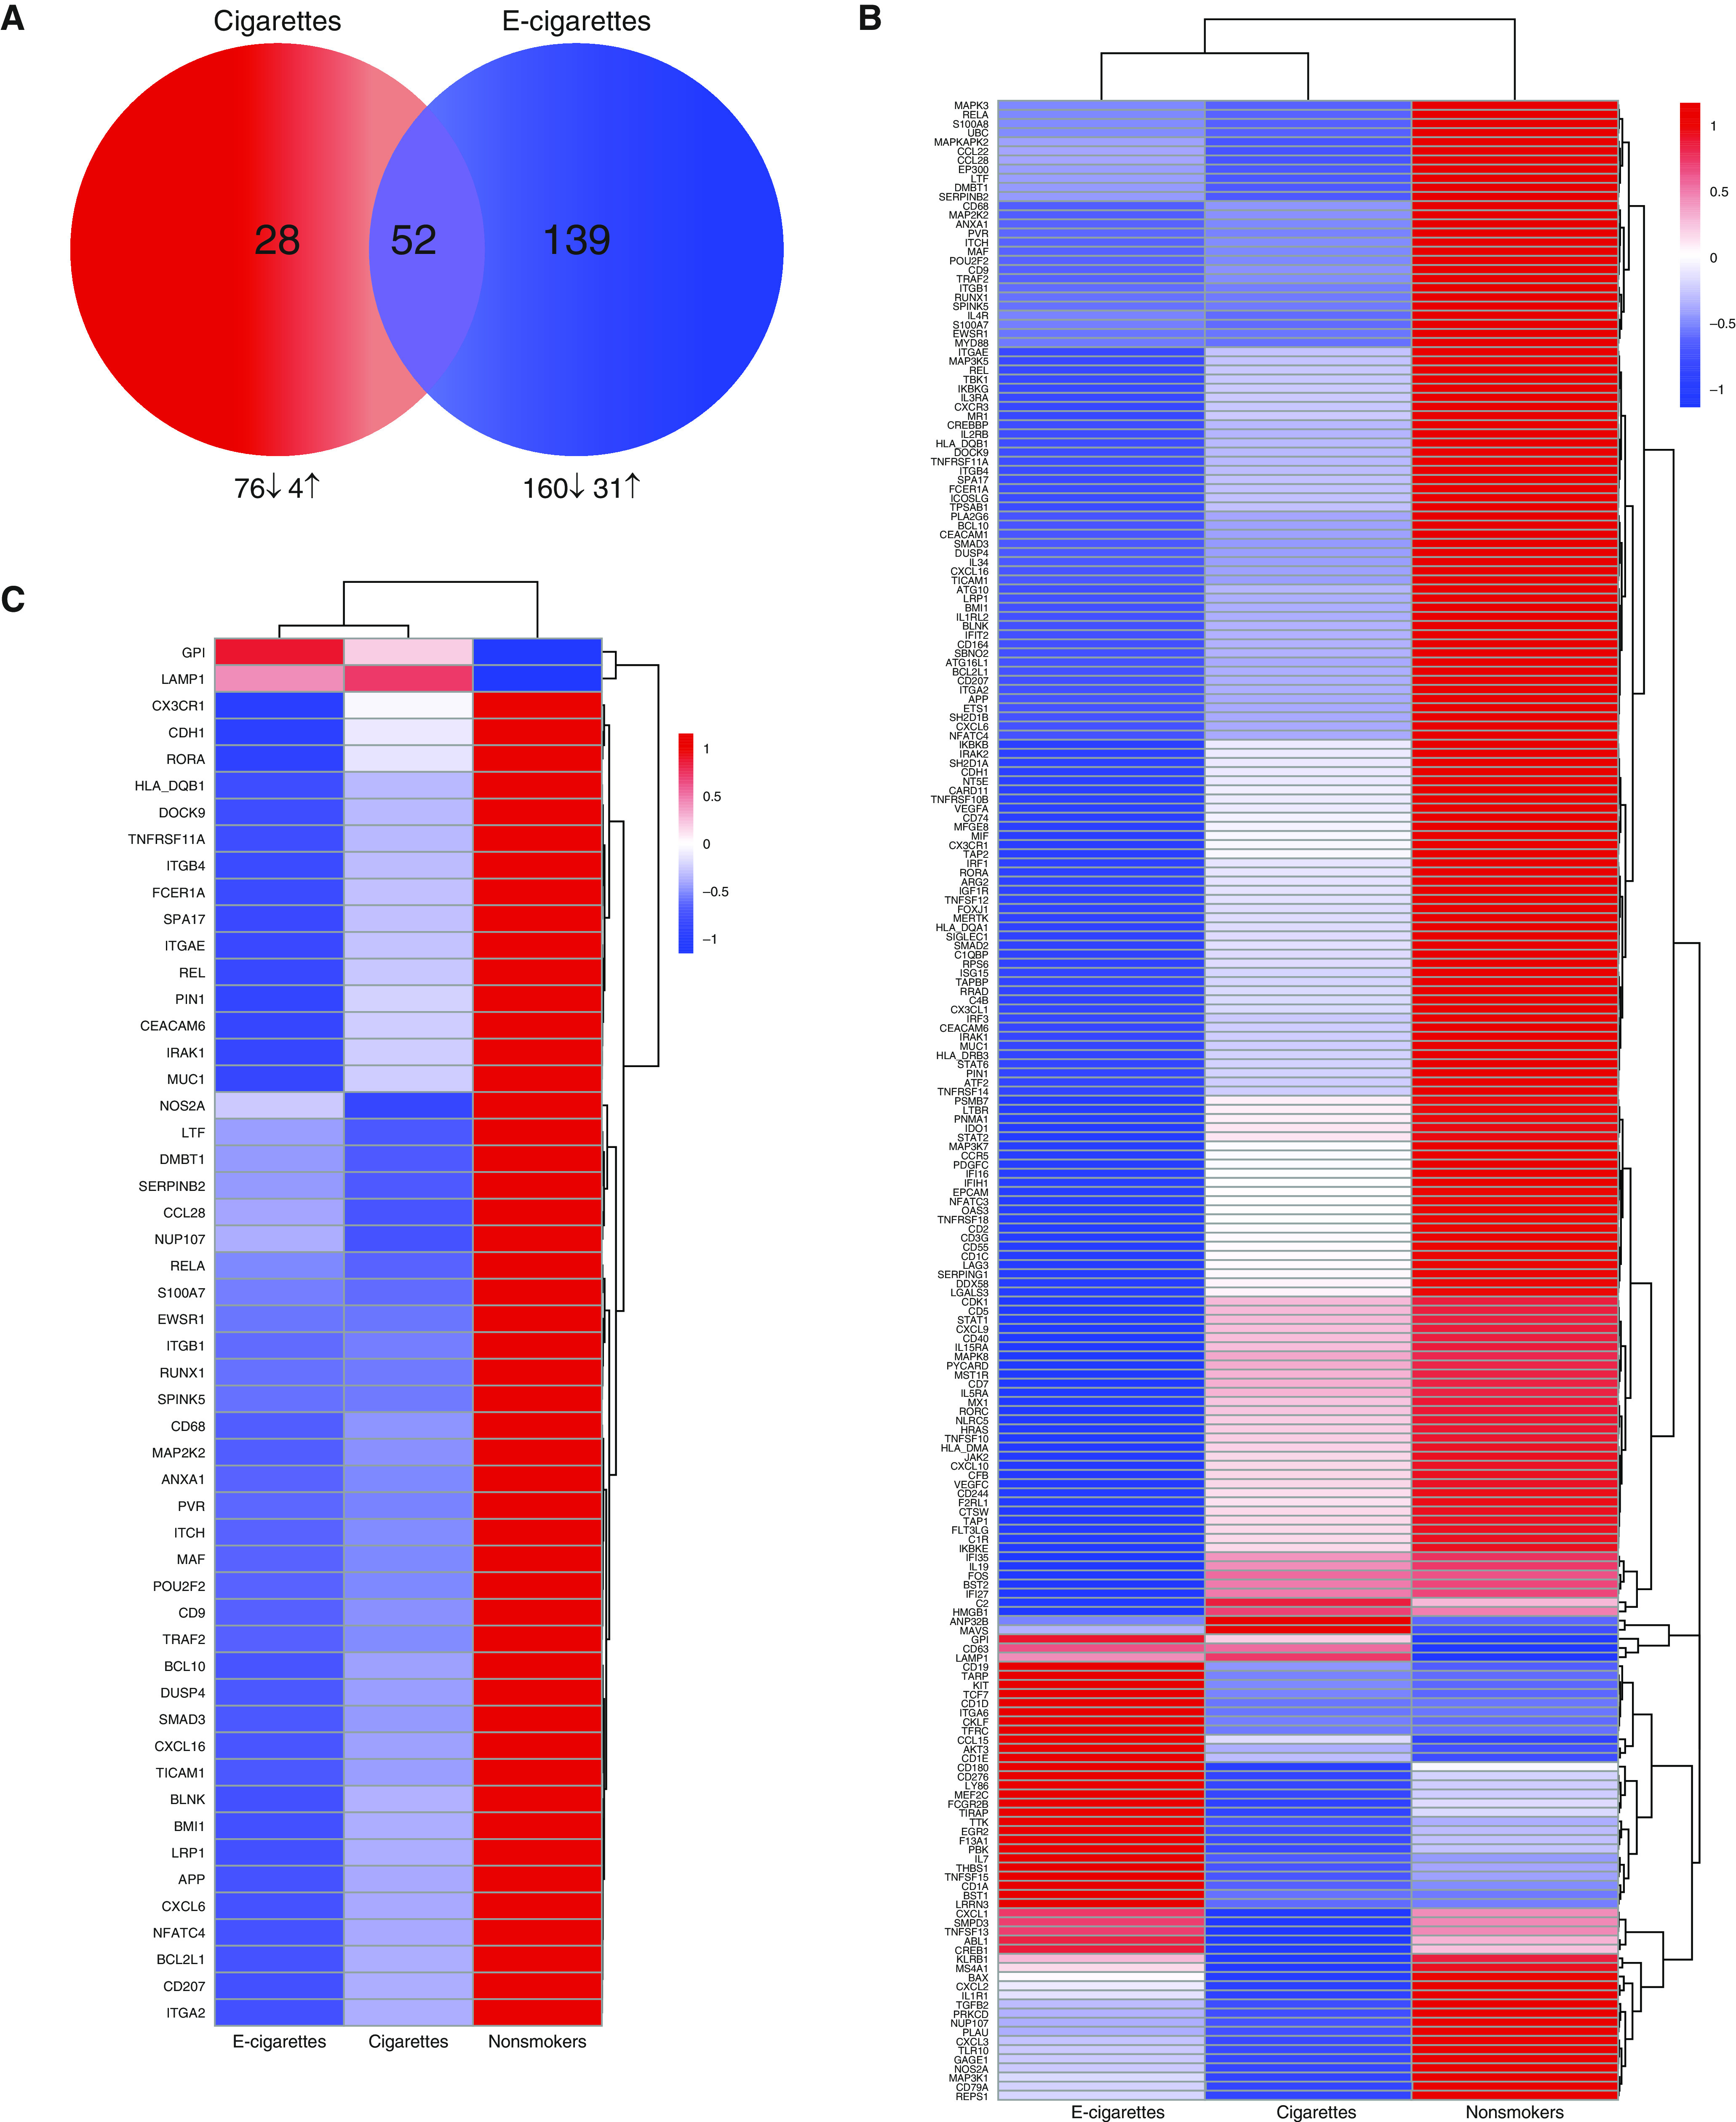
Figure 4.

Aggregate effect of tobacco products on response to LAIV inoculation. (A) Venn diagram of differentially expressed (DE) genes in cigarette and e-cigarette groups compared with nonsmokers in response to LAIV inoculation using the baseline-corrected area under the curve (AUC). The total number of DE genes are in the circles labeled cigarettes (red) and e-cigarettes (blue). Numbers and directional arrows below the Venn diagram show numbers of DE genes up- and downregulated for each group. (B) Heatmap of all (219 genes) aggregate baseline differences in each exposure group. (C) Heatmap of aggregate baseline differences that overlap in the e-cigarette and cigarette exposure group (52 genes). Log2 averages for each gene are displayed. Data included are DE genes (P < 0.05 and fold change = |1.5|) in smokers and e-cigarette users compared with nonsmokers.
