Figure 4.
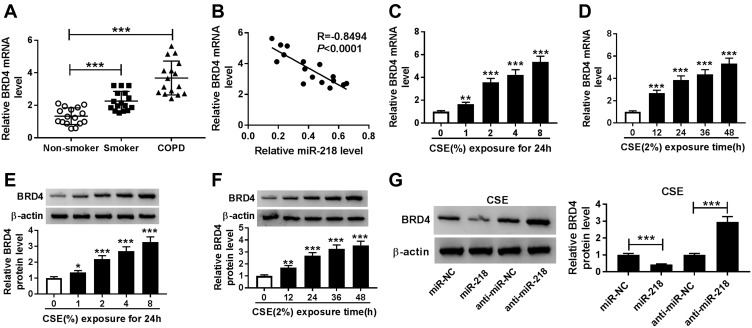
The expression level of BRD4 in COPD tissues and CSE-induced BEAS-2B cells. (A) RT-qPCR assay was performed to determine BRD4 level in COPD tissues and control groups. (B) Pearson’s correlation analysis was performed to analyze correlation relationship between miR-218 and BRD4 in COPD tissues. (C–F) RT-qPCR and Western blot assay were used to assess BRD4 levels in CSE-induced BEAS-2B cells. (G) The protein level of BRD4 was analyzed by Western blot assay in CSE-induced BEAS-2B cells transfected with miR-NC, miR-218, anti-miR-NC, anti-miR-218. Data are shown as mean ± SD from three independent experiments. *P < 0.05, **P < 0.01, ***P < 0.001.

