Abstract
A neural network designed specifically for SPECT image reconstruction was developed. The network reconstructed activity images from SPECT projection data directly. Training was performed through a corpus of training data including that derived from digital phantoms generated from custom software and the corresponding projection data obtained from simulation. When using the network to reconstruct images, input projection data were initially fed to two fully connected (FC) layers to perform a basic reconstruction. Then the output of the FC layers and an attenuation map were delivered to five convolutional layers for signal-decay compensation and image optimization. To validate the system, data not used in training, simulated data from the Zubal human brain phantom, and clinical patient data were used to test reconstruction performance. Reconstructed images from the developed network proved closer to the truth with higher resolution and quantitative accuracy than those from conventional OS-EM reconstruction. To understand better the operation of the network for reconstruction, intermediate results from hidden layers were investigated for each step of the processing. The network system was also retrained with noisy projection data and compared with that developed with noise-free data. The retrained network proved even more robust after having learned to filter noise. Finally, we showed that the network still provided sharp images when using reduced view projection data (retrained with reduced view data).
Index Terms—: Deep learning, neural network, 2-D convolution, SPECT imaging, image reconstruction
1. Introduction
As a functional imaging modality, single photon emission computed tomography (SPECT) is important both clinically and in molecular imaging research. Detecting gamma photons emitted from radiopharmaceuticals, SPECT is used to evaluate normal physiology and a variety of disorders including cardiovascular disease [1], disorders of the central nervous system [2], [3], and cancer [4]. However, clinical SPECT systems suffer from low spatial resolution and sensitivity due to the need for a collimator to enable image reconstruction. The noise in SPECT images is higher than that of other medical imaging modalities such as positron emission tomography (PET) and magnetic resonance (MR) imaging. Those deficiencies have prevented SPECT from attaining its true potential, particularly for quantitative studies.
Statistical iterative reconstruction algorithms such as MLEM [5]-[8], OS-EM [9], [10], and MAP [11]-[13] have been developed to tackle those issues. However, improvement in resolution is still far from ideal due to unrecoverable losses of information to the null space caused by the collimator. Iterative reconstruction algorithms solve the inverse problem by iteratively updating an image estimation to satisfy a certain criterion. Criteria of image quality, such as spatial resolution, gradually improves with iteration at the cost of computational time, but image noise increases concurrently. To control noise, reconstruction is often stopped early, before converging. The images obtained are sub-optimal in the sense that the desired criterion is not fully satisfied. Additionally, iterative reconstruction tends to be time-consuming, and the accuracy of the system matrix in modeling imaging physics may affect results. Accordingly, it is desirable to develop a reconstruction method for SPECT with high spatial resolution that is robust to noise, and insensitive to missing data.
Recently, machine-learning (ML) based image reconstruction techniques have been successfully implemented in MRI [14]-[16], CT [17]-[19], and PET [20]-[22], and have been shown to produce higher-quality images with lower noise, higher contrast, and higher resolution than those generated using conventional approaches. However, ML techniques for SPECT image reconstruction are rare. Those that have been reported merely restore images after reconstruction [23]. A genuine ML-based reconstruction method that directly reconstructs activity images from SPECT projection data has not been reported. The learning process of such a neural network would be to find the best parameters (weights and bias) in each layer of the network with a logic and reasonable architecture, by using a back-propagation algorithm, given the input data corpus (projection data and attenuation map) and the desired output image corpus (ground truth), i.e., the activity images.
Here a deep neural network (DNN) feed-forward architecture composed of fully connected (FC) layers followed by a sparse convolutional optimizer is proposed. The FC layers focused on reconstructing a basic profile of the uptake region, which was then compensated for the attenuation using the following 2-D convolutional layers, using the corresponding attenuation map. The image optimization, such as noise filtering and contrast improvement, was also built into the convolutional layers. A detailed description of the learning system is elaborated in Section II of this paper. The proposed network is targeted to accurately reconstruct the DAT SPECT images with focus on striatum for Parkinson disease diagnosis, using tracers such as 123I FP-CIT [24].
The presented neural network was trained by 16,000 simplified digital 2-D brain phantoms, validated by other 2,000 examples for tracking learning progress, and finally tested by another isolated 2,000 phantoms. The Zubal human brain phantom [25] was also employed to evaluate the performance of the system. The reconstruction results were compared with those reconstructed from the traditional OS-EM algorithm, and showed that better performance was achieved from the DNN. Compared to earlier work [26], here we did not use an image-compressing network to extract features specifically from striatum within the brain, so the conversion from projection data to the image was performed by a single network. To understand better how the DNN was able to reconstruct activity images from the projection data, we investigated intermediate results by the hidden layers to make transparent the step-by-step DNN reconstruction process. Next, the DNN was retrained when the clinic-level noise was added to the projection data. The retrained network performed more robust than the network trained with noise-free data due to the new capability of noise filtering (for the projection data), demonstrated by the simulation data with noise and clinic data. Finally, we investigated the feasibility of using our DNN for reconstructing images from projection data with reduced view angles.
2. Algorithm and Network Architecture
A neural network designed to solve inverse problems works differently from traditional reconstruction algorithms. When suitable neural network architecture for solving a specific problem is established, we try to find the mapping rules between two different domains (image and projection data) by updating the learnable parameters in the neural network based on a large training data set. The imaging physics are implicitly included in the mapping rules through the training. As a result, a fully trained neural network can produce a result almost instantaneously since no iteration is required. The image result is also expected to be more accurate than that produced from traditional reconstruction methods when the neural network is trained with true activity distributions with high resolution.
When a neural network is developed as an image reconstruction operator, it produces desirable images from measured data when the mapping rules between the data and image domain have been well learned. Unlike neural networks developed to solve classification problems, input data rescaling is usually not allowed in image reconstruction problems because a quantitative solution is often desired. Here we established an architecture that uses FC layers to process the projection data, and the result was then further improved with the attenuation map to create a more accurate image by multiple 2-D convolutions. Assuming the input signal is the raw projection data xn having n elements, which is passing an FC layer containing m neurons, the input signal xn is multiplied by an m-row-n-column weight matrix to which a bias is added, and is finally activated by a non-linear function ⊙, i.e.
| (1) |
where Wmn is the weight matrix and bm is the bias vector. Their subscripts denote the number of elements in the matrix or vector. For convenience, we simplify (1) to
| (2) |
When multiple layers are employed, assuming the output has l elements (l voxels in the reconstructed image), we get
| (3) |
when two FC layers are applied. Here, the second FC layer must have l neurons, the same as the outputs. For SPECT, an attenuation map is often included for compensation. Thus, zl is then fed to a 2-D convolutional layer to improve the image quality:
| (4) |
where μ represents the attenuation map, often obtained from a computed tomography (CT) or a transmission scan, and C denotes a 2-D convolutional computation. Usually, the same convolutional structure is repeated multiple times to achieve higher quality. Hence, a DNN that converts projection signals to an image can be denoted by
| (5) |
when two FC layers are followed by a repeated convolutional computation p times. In such a proposed neural network structure, the two FC layers are expected to perform a basic reconstruction, and the convolutional layers are expected to compensate and optimize the reconstructed image. The ultimate output is the desired activity image having the same number of voxels as in and zl.
Following the logic described above, we proposed a network architecture as displayed in Fig. 1. The input layer containing two channels accepts the projection data and the attenuation map, respectively. The projection data, stored in sinogram format, was fed to the fully-connected layers FC1 and FC2 to produce l outputs. Therefore, the number of neurons set in FC2 has to be equal to the number of outputs, i.e., l. The geometric mean of the number of inputs to FC1 and the number of outputs from FC2 was used to determine the neuron number in FC1, i.e.,
| (6) |
Each FC layer was activated by a hyperbolic tangent function. The output of FC2 was then reshaped to an L by L (L × L = l, e.g., L = 128) array and concatenated with the attenuation map before being delivered to the subsequent convolutional layers for compensation and optimization. Five convolutional layers, each convolving 64 filters of 3 × 3 with stride 1 and followed by a batch normalization layer and a rectifier linear unit (ReLu), were implemented to optimize the image. A deconvolution layer (note that this is not a transposed convolution), convolving 64 filters of 5 × 5 with stride 1, was placed at the end of the network to produce a single L by L output array representing the final reconstructed image. The training process of the proposed neural network is detailed in the next section.
Fig. 1.
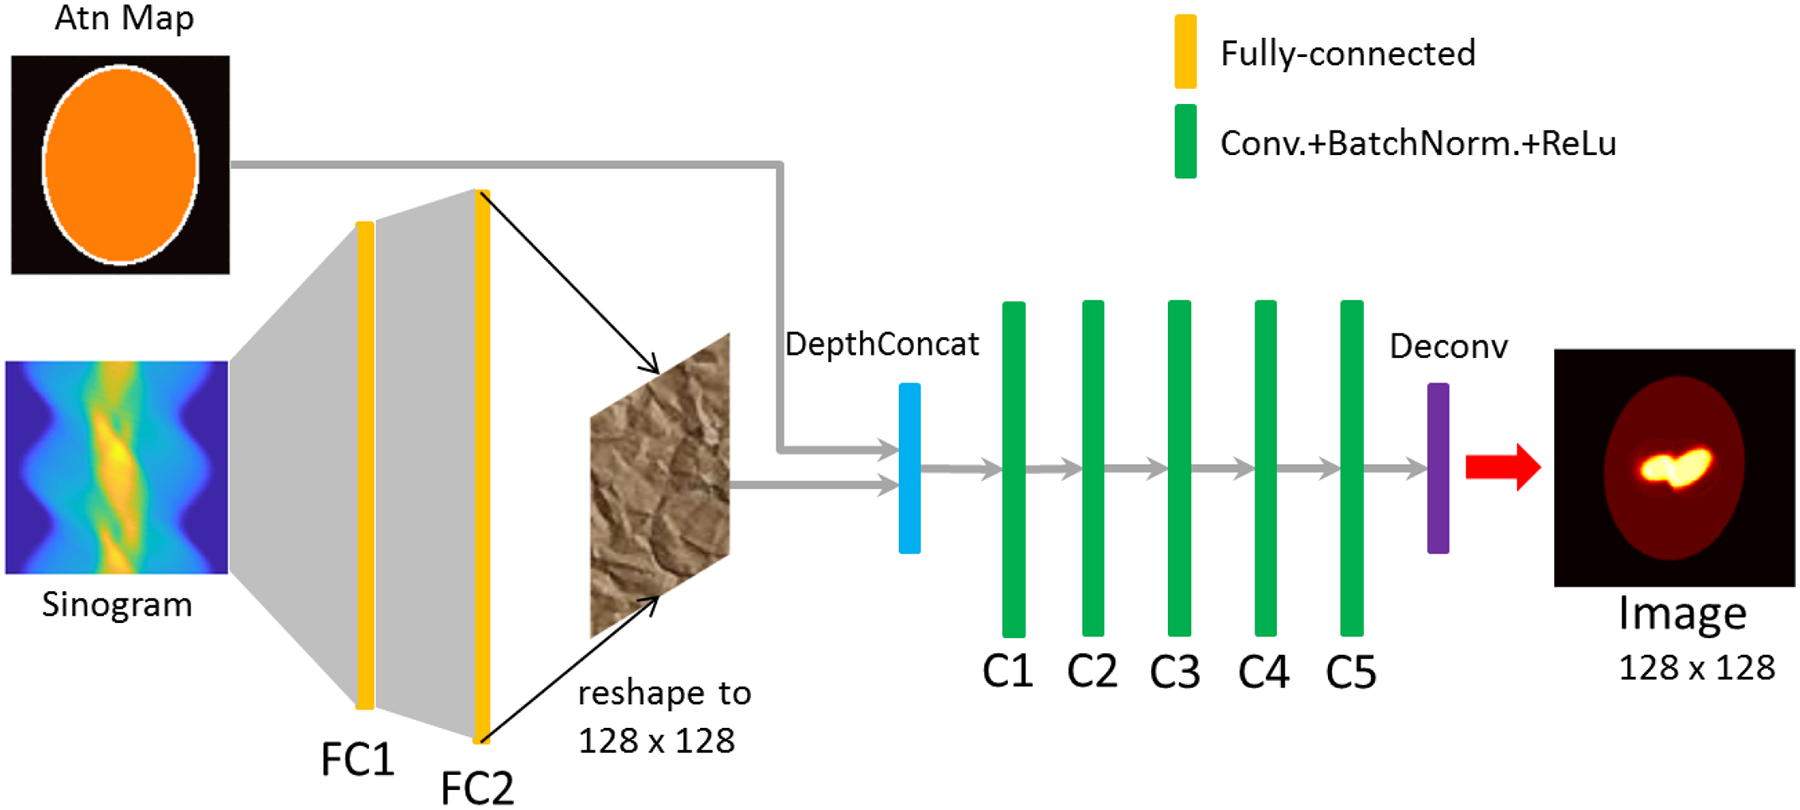
The architecture of the proposed deep neural network (DNN) for SPECT medical imaging. The input layer is comprised of two channels to accept the projection data (sinogram) and the attenuation map, respectively. The output of the neural network is the reconstructed activity image. Projection data were fed to the fully connected layers, FC1 and FC2, and the output of FC2 and the attenuation map were together delivered to the subsequent convolutional layers (C1~C5). Each convolutional layer was followed by a batch normalization layer and nonlinear rectifier linear unit (ReLu) function.
3. Network Learning and Development
A. Data Generation
Neural networks often suffer from training on limited patient data [22], [23]. Such networks are likely overfitted. To avoid overfitting, data used for training must be rich. Accordingly, we developed software that generates elliptical 2-D brain phantoms with random characteristics. Each phantom generated by that software is comprised of a pair of images: an activity image and a corresponding attenuation map. Example phantoms generated by this software are displayed in Fig. 2. Fig. 2(a) shows eight activity images, and Fig. 2(b) shows the corresponding attenuation maps. All images are 128 by 128 pixels, and each pixel denotes a 2-by-2-mm voxel. Each unique uptake region in the activity images also indicates the region of interest (ROI) for quantitative analysis. The high-uptake areas in the activity image may appear in any place in the brain, with random shapes and the activity value ranging from 3 to 9. The rest of the brain was assigned to 1 consistently in all activity images, and the region outside the head was assigned to zero. We generated 20,000 2-D phantoms, each unique in the database. Phantoms with high-uptake areas assigned to an activity of 6 were the most prevalent cases in the database. The number of phantoms decreases as the assigned activity value becomes larger or smaller, as summarized in Fig. 2(c). The number of phantoms meets a normal distribution according to the assigned values of the high-uptake areas in the activity image.
Fig. 2.
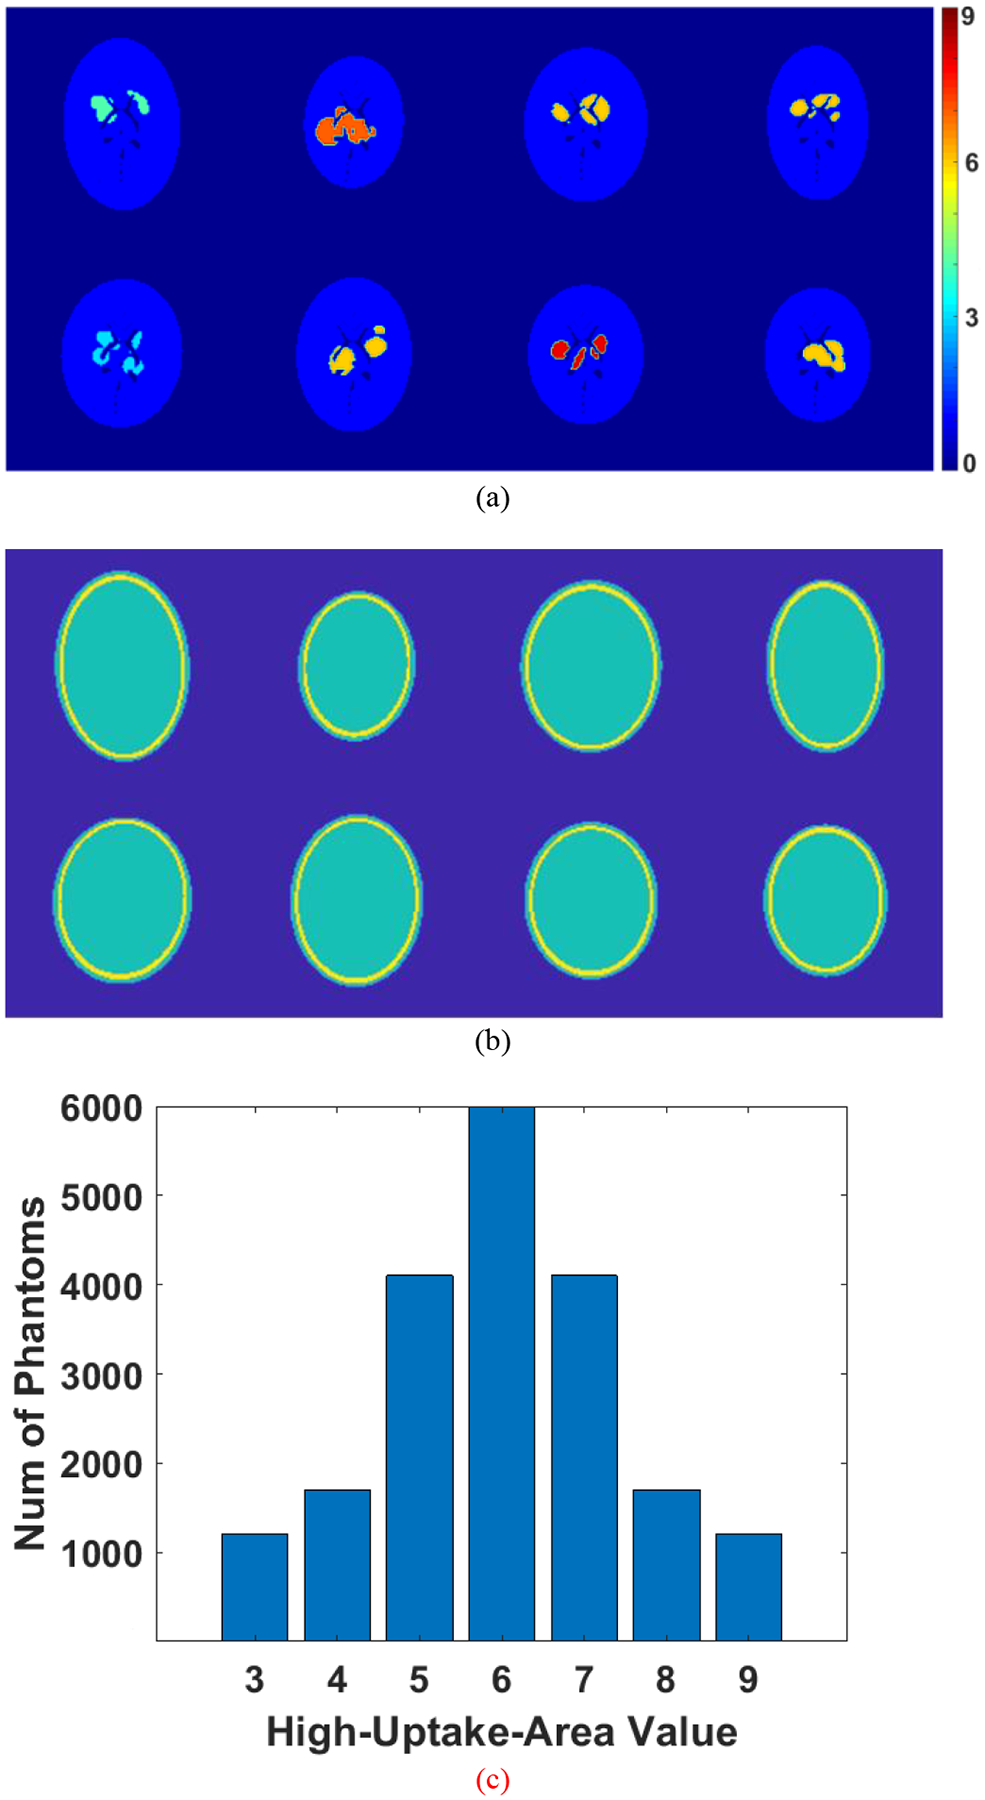
Generated 2-D brain phantoms by the custom software. (a) activity image; (b) corresponding attenuation map for the activity image in (a); (c) The number of phantoms in the database determined by the assigned values of the high-uptake area in the activity image.
These phantoms were used to produce SPECT projection data through an analytical simulation that modeled effects of attenuation and distance-dependent spatial resolution. A total of 120 views over 360° (3° spacing between two views) were generated with 128 bins for each view, yielding a 120-by-128 sinogram array. The spatial resolution was modeled using spatially varying Gaussian functions based on a LEHR collimator [27]. The projection data and attenuation map serve as the network input, while the activity images will be used as the ground-truth output for training. The 20,000 phantoms and their corresponding projection data were split to three groups: 16,000 were selected out for training the parameters in the neural network, 2,000 were used for validation, and the rest for final testing.
B. Network Training
As mentioned in Part A, the selected 16,000 phantoms and projection data were used for training the DNN. Training was accomplished by minimizing a common mean-square-error function using the ADAM optimizer, with the initial learning rate set to 10−5 (optimal value was determined after a few trials varying in orders of magnitude) and the squared gradient decay factor 0.99. Since the initialization of parameters can impact the network convergence speed, weights were all initialized with the He initializer [28], but the biases were initialized with zero. L2 regularization, the most appropriate value of which was found to be 0.02 after a few trials by monitoring the loss of validation data during the training, was applied to reduce the chance of network overfitting of the training data. The minibatch size was set to 1% of the total training-data pool, i.e., 160 example The minibatch data were shuffled after each epoch during the training.
The root mean square error (RMSE) was checked using the 2,000 phantom validation data when each epoch was complete during the training. The evolution of RMSE along with the training epochs is illustrated in Fig. 3. Learning was terminated after 50 epochs as no apparent progress was seen for 5 consecutive epochs, which took approximately 2.5 hours on a NVIDIA Quadro P6000 GPU mounted on a workstation equipped with 3.0 GHz Xeon CPU and 128-GB memory.
Fig. 3.
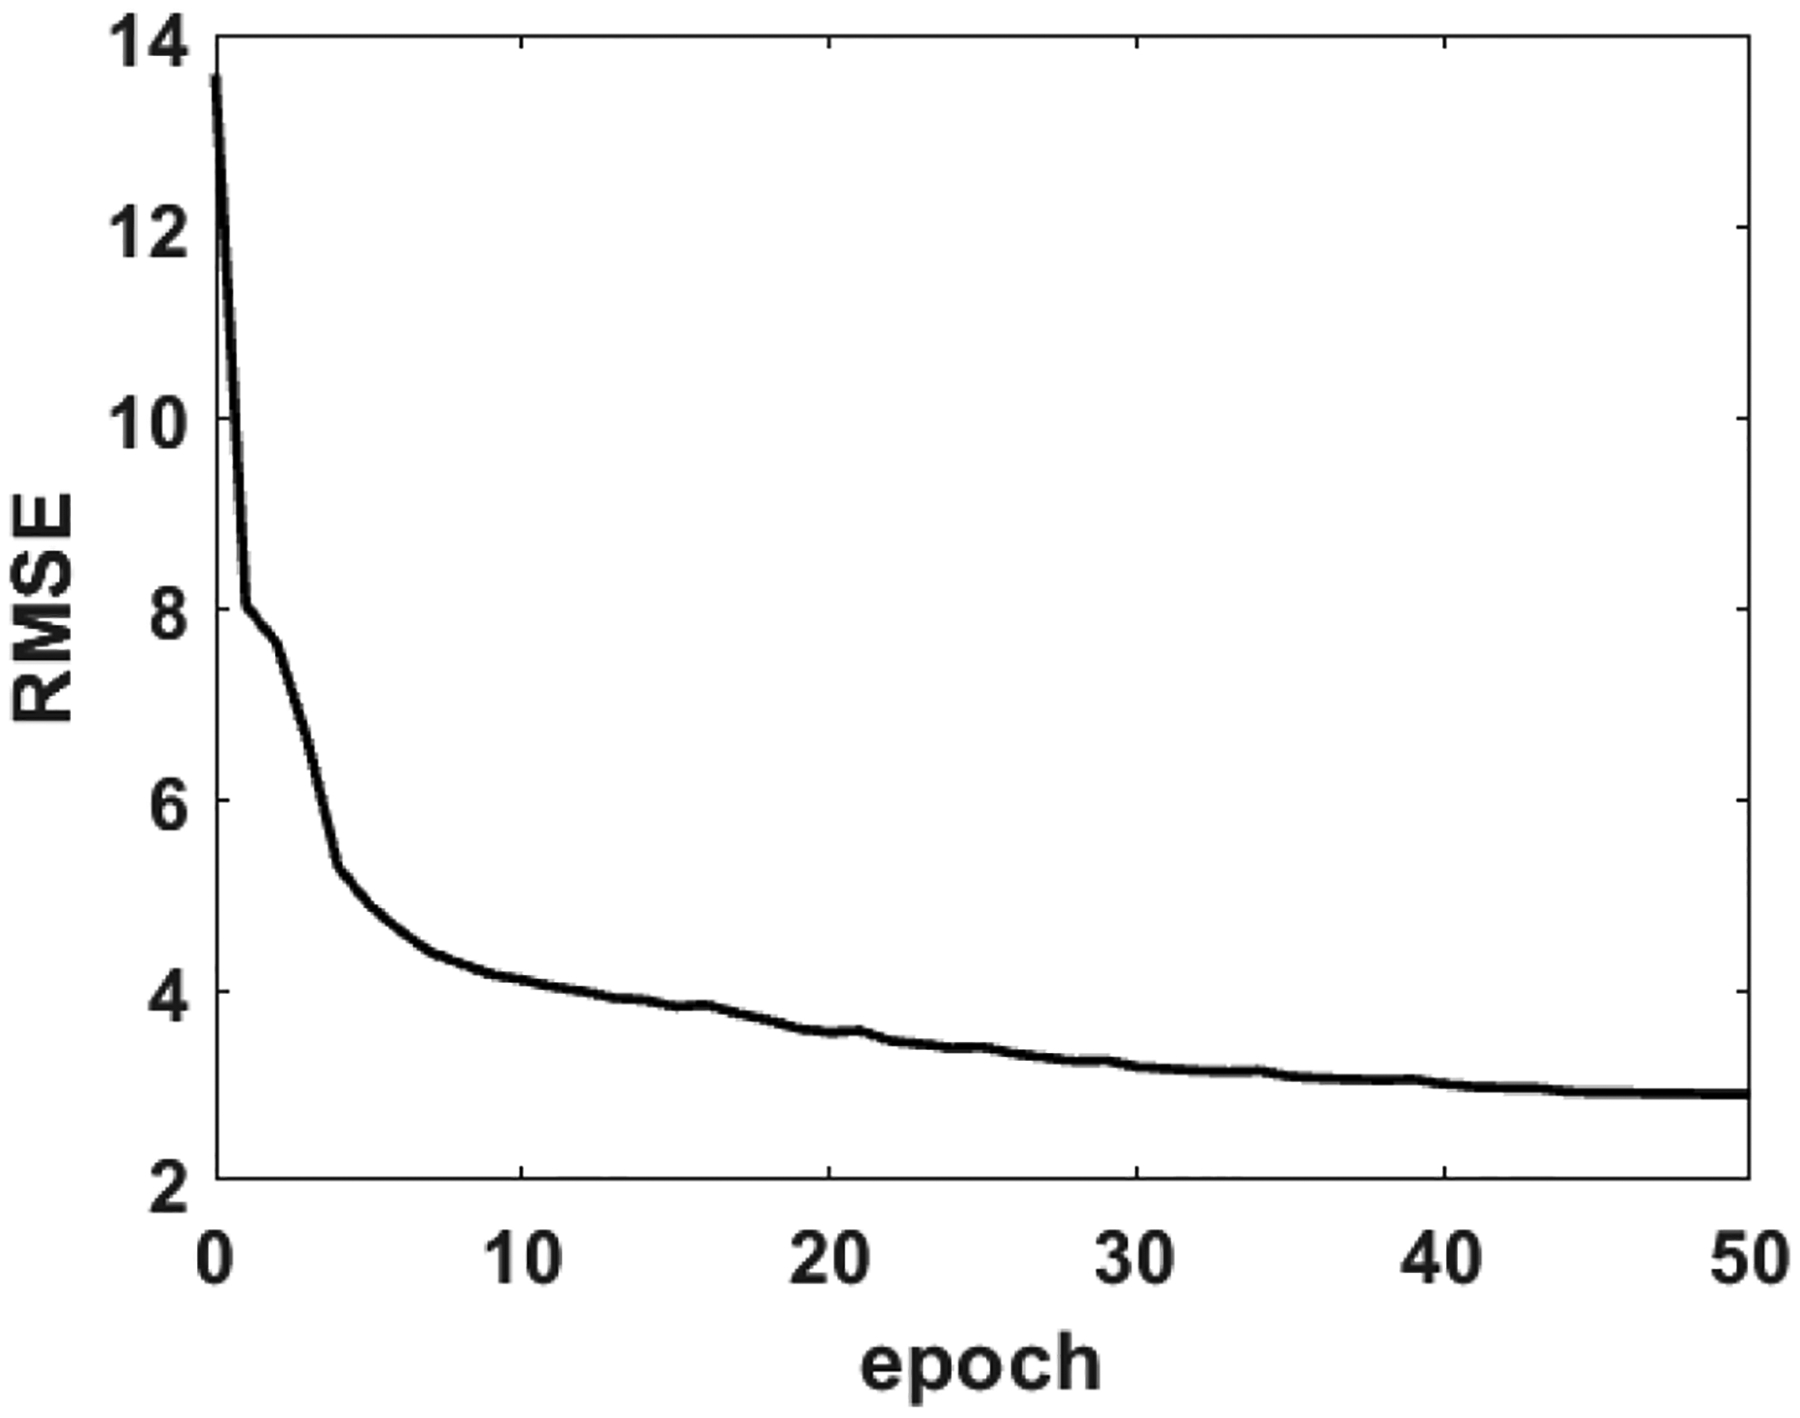
The evolution of RMSE with the epochs during the learning.
The convolutional kernels were inspected when the training was complete in order to verify that specific rules had been learned by kernels and that an appropriate number was included in each convolutional layer. Fig. 4 shows the 64 convolutional kernels in the deconvolution layer. When each kernel contains substantial pixel variation, one may consider increasing the number of kernels for higher performance. If a number of kernels in a layer do not contain valuable information (for example, parameters are all close or zero), one may consider reducing the number of kernels to ease unnecessary computational burden.
Fig. 4.
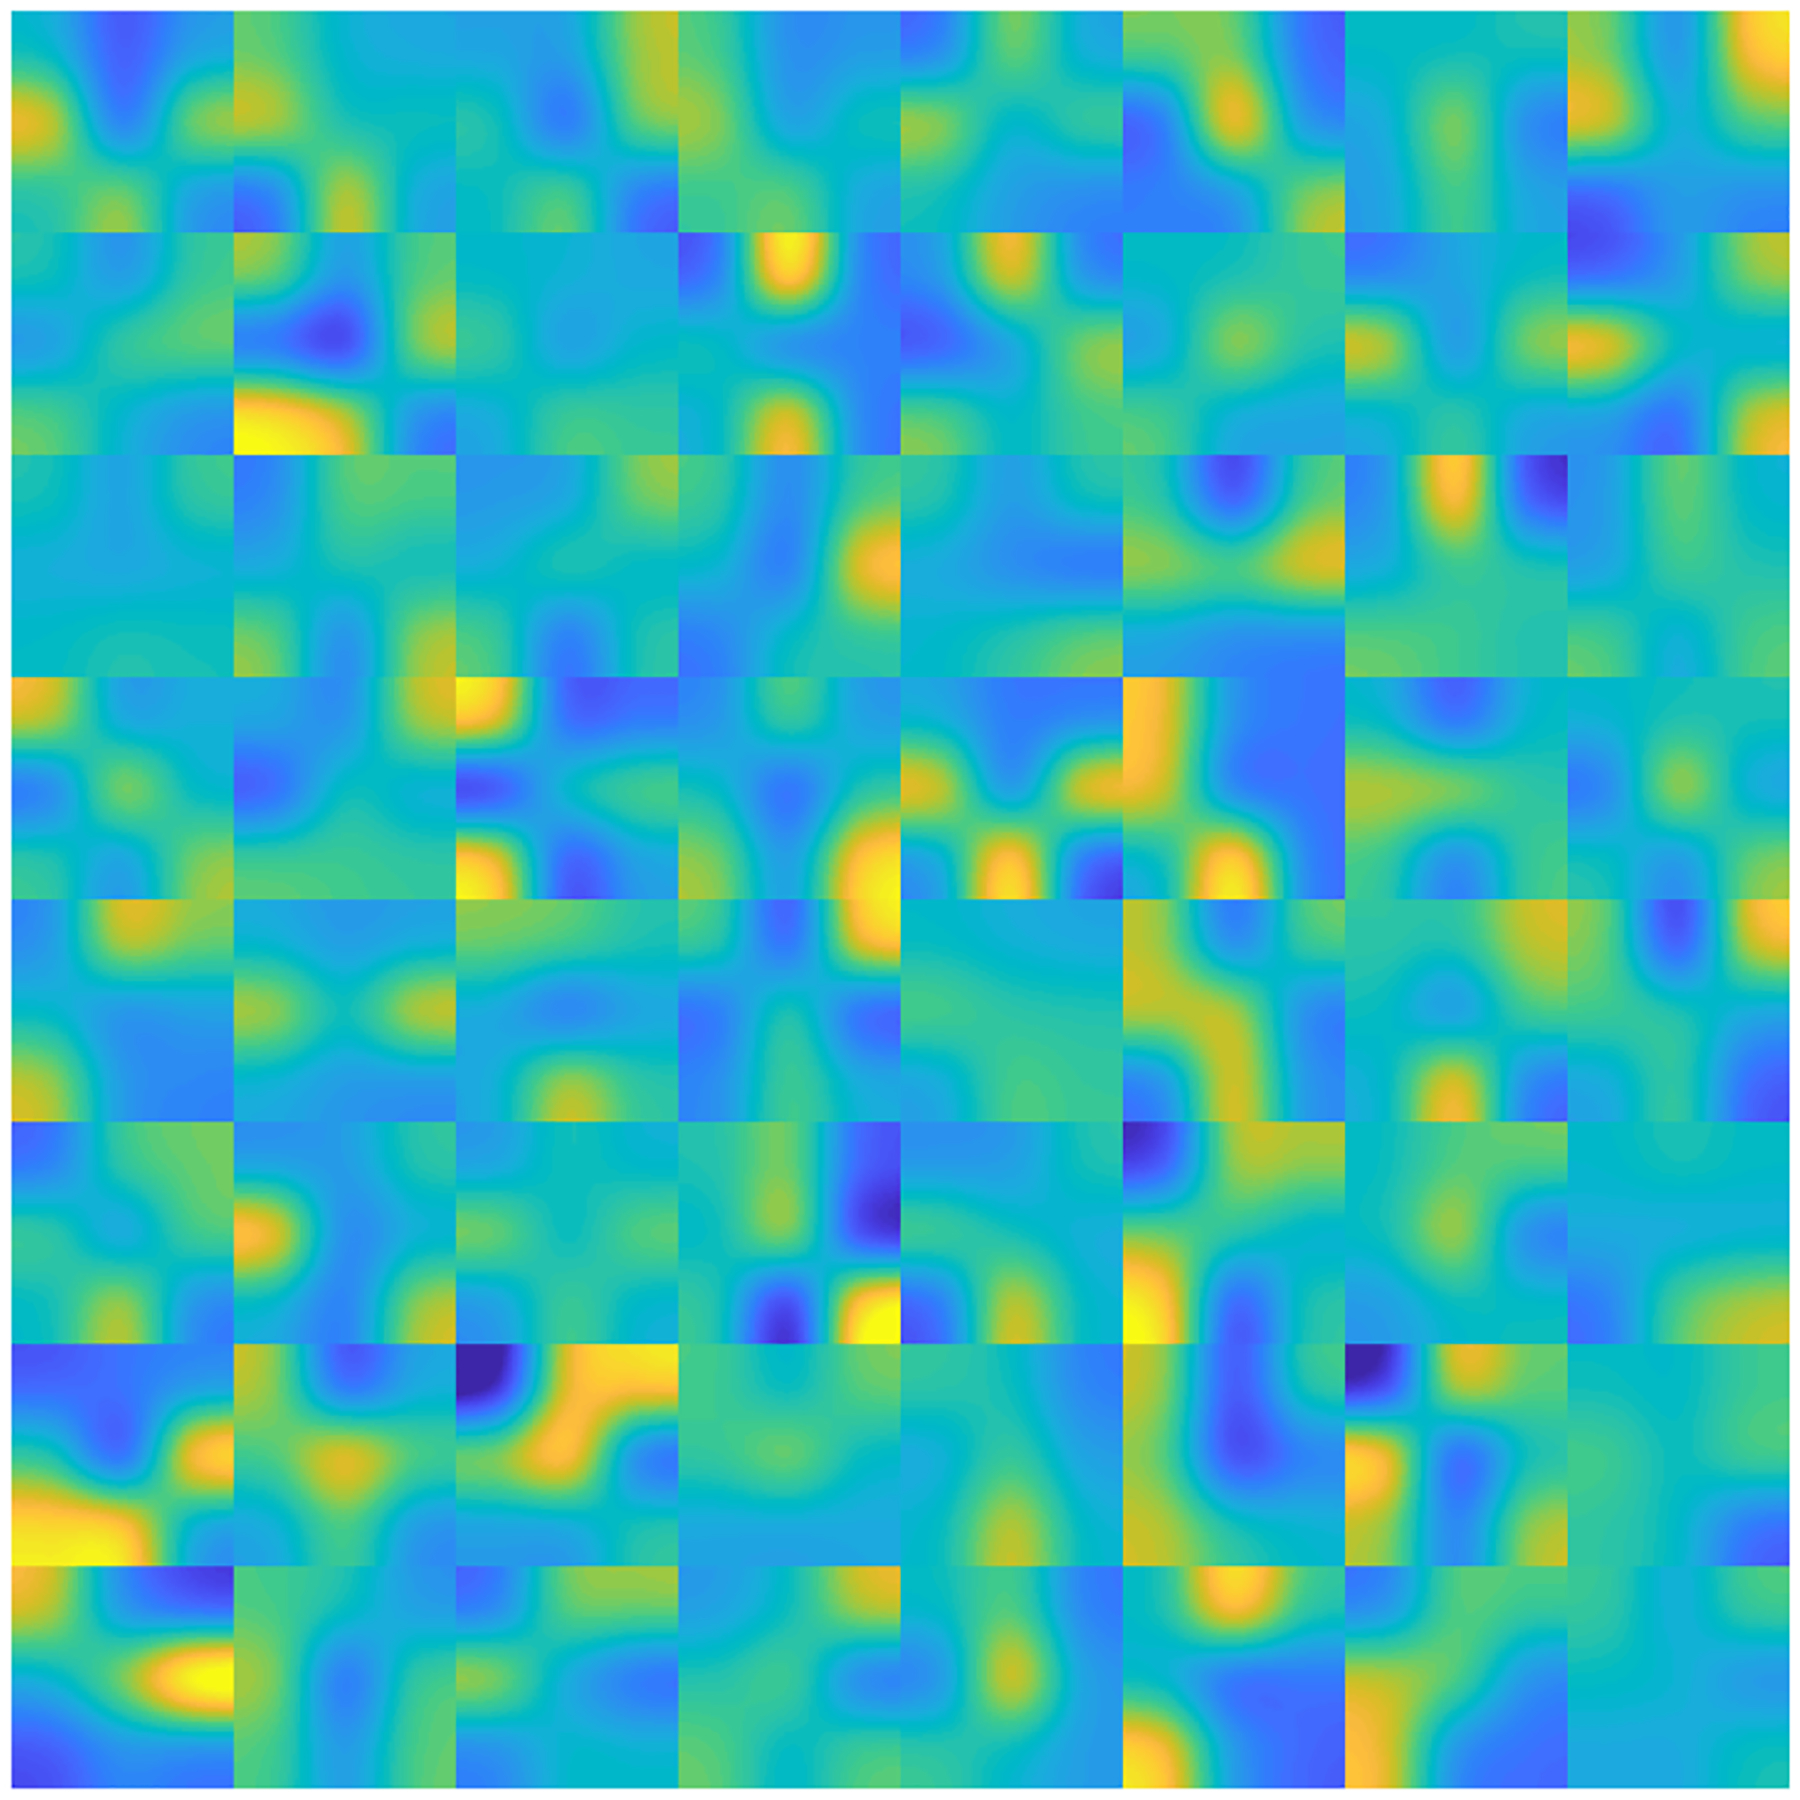
The 64 convolutional kernels in the deconvolution layer. Each sub-block represents a kernel composed of a 5×5 array.
4. Reconstruction Results and Comparisons
A. Reconstruction with Noise Free Projection Data
The 2,000 phantom projection datasets and attenuation maps from the test data pool that were not used in training were applied to test the reconstruction performance of the developed neural network. The DNN required 4 seconds to reconstruct 2,000 activity images from the associated data.
Example reconstructed images are illustrated in Fig. 5. All images are 128 by 128 with each pixel representing a 2 × 2-mm voxel. The first column (Fig. 5(a)) shows the ground-truth image with different phantom shapes, high-uptake regions, and the value in the high-uptake region. The second column (Fig. 5 (b)) shows the reconstructed image by the developed neural network. As can be seen, the phantom shape and the high-uptake areas have all been correctly presented. The borders of the brain regions are very clear, suggesting high imaging resolution. For comparison, we also presented OS-EM reconstruction results shown in the fourth column (Fig. 5(d)). Each OS-EM image was selected from a number of iterations that gave the lowest error (difference from the ground truth, as quantified in (8)). Eight to 20 iterations with 12 subsets per iteration took 6 to17 seconds to converge. The OS-EM reconstruction included compensations for attenuation and distance dependent resolution. The distance dependent resolution was modeled using Gaussian functions computed based on an low-energy high-resolution collimator [30]. Images reconstructed by OS-EM had reduced image contrast and were blurred due to poor resolution. There were also Gibbs ringing artifacts in all OS-EM images due to resolution compensation, which was not identified in the DNN images. To compare the images reconstructed by the two methods, Fig. 5 columns (c) and (e) show the error image by subtracting the ground-truth image from the reconstructed image:
| (7) |
where Ir denotes the reconstructed image, Itrue represents the ground-truth image. The computation was conducted only in the uptake (non-zero) area. Each pixel shown in the error image represents a percentage error with respect to the true pixel value in the ground-truth image. Note that the percentage error in the OS-EM error images may exceed 100%, which occurs in the low-uptake background area adjacent to the high uptake regions due to the spill-over caused by limited spatial resolution. OS-EM produced more errors than did the DNN.
Fig. 5.
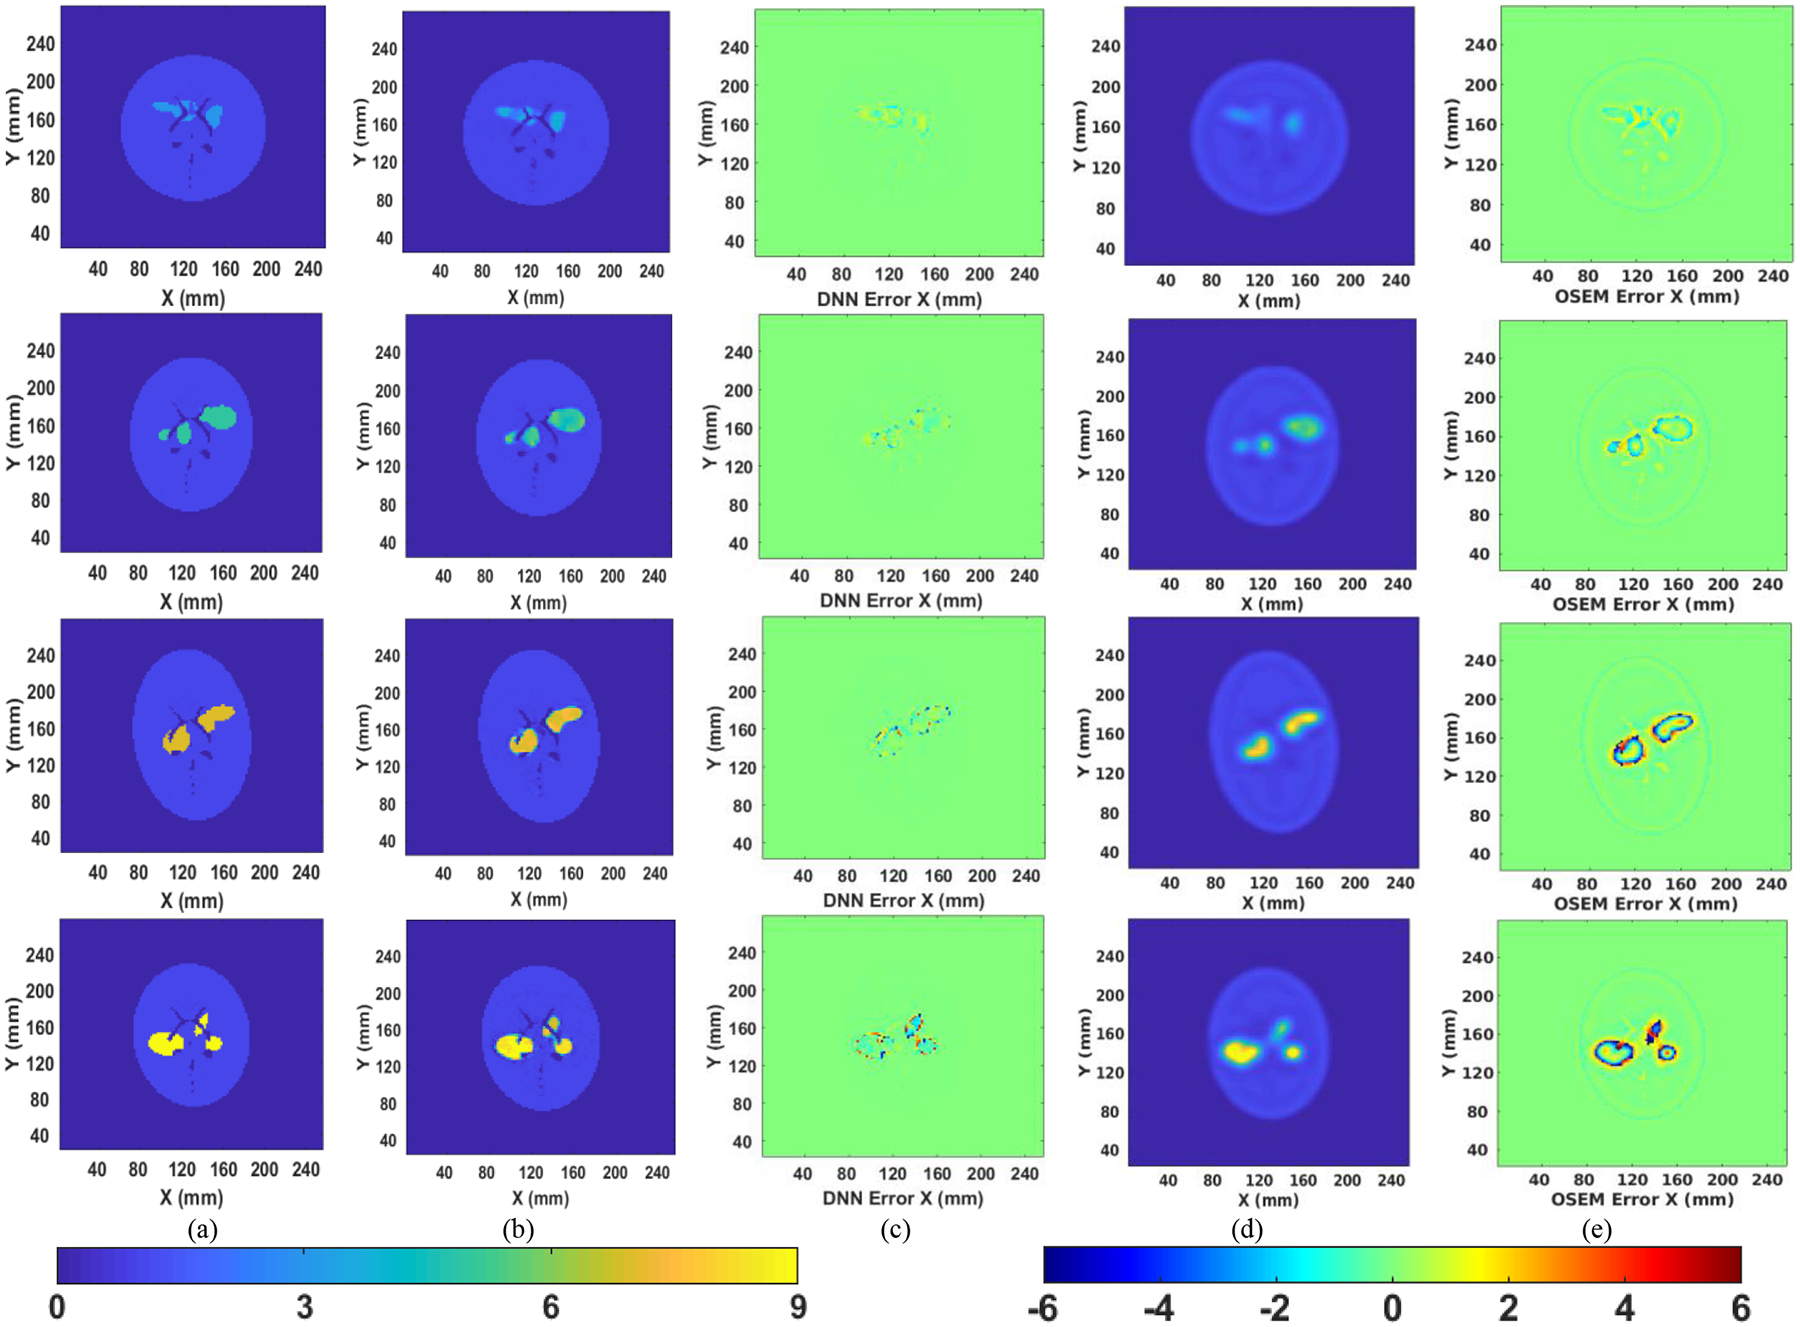
Comparison of the DNN reconstructed image with ground truth. (a) is the ground truth; (b) is the reconstruction by the DNN; (c) is the percentage error image of DNN reconstruction with respect to ground truth; (d) is the reconstruction by OS-EM; (e) is the percentage error image of OS-EM reconstruction with respect to ground truth. The left color bar applies to the ground-truth image in column (a), and the reconstructed images in Column (b) and (d) only. The right color bar applies to the error images in Column (c) and (e) only.
To compare the errors quantitatively, we calculated the relative error in (d) and (e) and summed the values by using
| (8) |
so the error could be described by a number and compared in Table I. For all the cases, the DNN method provided smaller error than OS-EM. The same operation was also performed for all 2,000 test images reconstructed by the DNN to find their summed error calculated by (8). Of all the 2,000 examples, the minimum value was 140.3948, the maximum error was 230.2668, and the averaged value was 196.7745, which is equivalent to the level of errors for the DNN in Table I.
TABLE I.
Summation of the Error Images in Figure 5
| Image | DNN | OS-EM |
|---|---|---|
| Row 1 | 185.1650 | 455.5783 |
| Row 2 | 187.8521 | 556.7279 |
| Row 3 | 208.4169 | 655.6738 |
| Row 4 | 219.8826 | 815.0271 |
Comparison was also conducted specifically for the high-uptake areas. We present the average and standard deviation for the high-uptake values for the DNN- and OS-EM reconstructed images, respectively (Table II). Values presented by the DNN were closer to the truth than those generated by OS-EM, with a lower standard deviation provided by the DNN.
TABLE II.
Averaged High Uptake-Area Values and Standard Deviation (SD) for The Reconstructed Images in Figure 5
| Image | Truth | DNN | OS-EM |
|---|---|---|---|
| Row 1 | 3 | 2.89 (0.40) | 2.24 (0.59) |
| Row 2 | 5 | 4.76 (0.84) | 4.15 (1.14) |
| Row 3 | 7 | 6.62 (1.31) | 5.76 (1.80) |
| Row 4 | 9 | 7.96 (1.37) | 6.92 (2.40) |
Since there is no theoretical explanation as to why DNNs can produce high-quality images, we attempted to unveil the behavior of the DNN within several of the hidden layers. We present the output of Layers FC2, C1, C3, and C5 in Fig. 6, where a dataset chosen from the test-data pool was fed to the DNN input layer. As expected, the FC layers were able to reconstruct a basic profile from the projection data without an attenuation map. The initial reconstructed image (Fig. 6, FC2 Recon.) contained high noises and was in low contrast. That image as well as the attenuation map was then fed to C1 for improvement. C1 convolved the two images and produced 64 feature images. Leveraging the correction by the attenuation map, some feature images produced by C1 were able to highlight the uptake area and better contour the phantom profile. Such operation was repeated and the effect was reinforced by the subsequent two convolutional layers. The outputs of C3 are composed of 64 feature images with higher contrast. When it came to C5, the contrast of the high-uptake area to the background was further improved, and the noise outside the uptake region has been attenuated in many of the feature images. As expected, the convolutional layers progressively optimized the reconstruction results from the FC layers, leveraging information from the attenuation map.
Fig. 6.
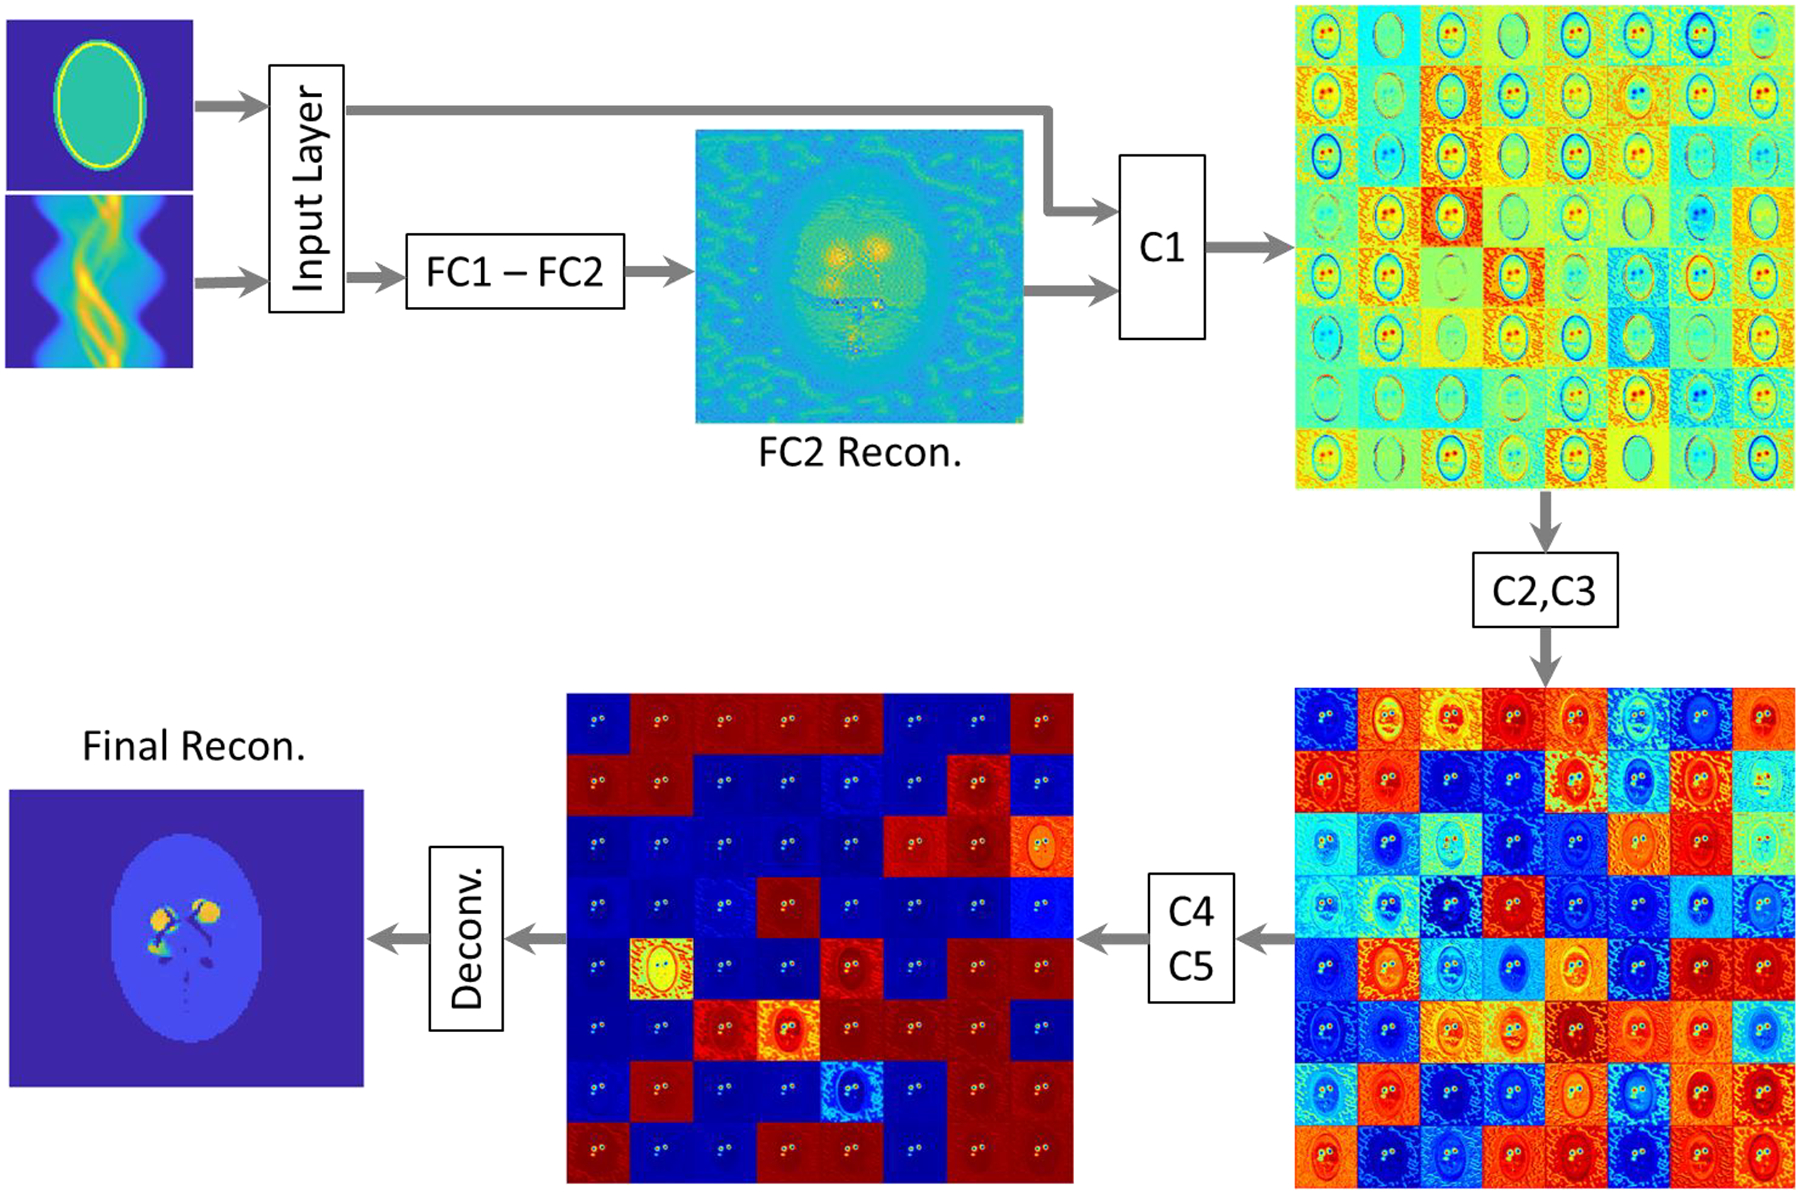
Data flow from an input sinogram and attenuation map to the reconstructed image by the DNN. Intermediate results by the hidden layer FC2, FC1, FC3, FC5 and the final result are presented. Only those layers were used due to space limitations.
B. Reconstruction with Noisy Projection Data
Projection data used above in training and testing were noise free. In a practical scenario projection data will contain noise. Accordingly, we added Poisson noise that matched levels seen in clinic to the 16,000 projection dataset used for training, and started a new training session. A more realistic phantom, the Zubal human brain phantom [25] with striatum to background activity concentration ratio of 6:1, was adopted to evaluate the performance after retraining the DNN. The same simulation method was implemented to acquire the projection data of the Zubal phantom, and the same level of Poisson noise was added to the projection data. The ground-truth activity image and the obtained sinogram are shown in Fig. 7(a) and (b), respectively. Next, the noisy sinogram was fed to the two DNNs, trained with noise-free data and noise-included data, respectively. Fig. 7(c) presents the reconstructed image by the DNN trained with noise-free projection data, and Fig. 7(e) shows the reconstructed image by the DNN trained with noise-included projection data. Fig. 7(g) is the reconstruction by OS-EM (6 iterations with 12 subsets per iteration, selected due to lowest difference from the truth). Fig. 7(i) illustrates the reconstruction using a MAP algorithm with anatomical region-based prior (ARPB) [30], [31]. The anatomical regions were defined based on the Zubal phantom, and the potential function was a Green function. The prior was applied to each anatomical region independently. The corresponding error images by the four methods are presented in Fig. 7(d), (f), (h), and (j), respectively. As a result, the retrained network provided the lowest error in the reconstructed image. The error produced by the MAP algorithm is between that of the OS-EM and DNN methods. The retrained neural network learned to filter noise and employed the useful information in the sinogram to reconstruct images.
Fig. 7.
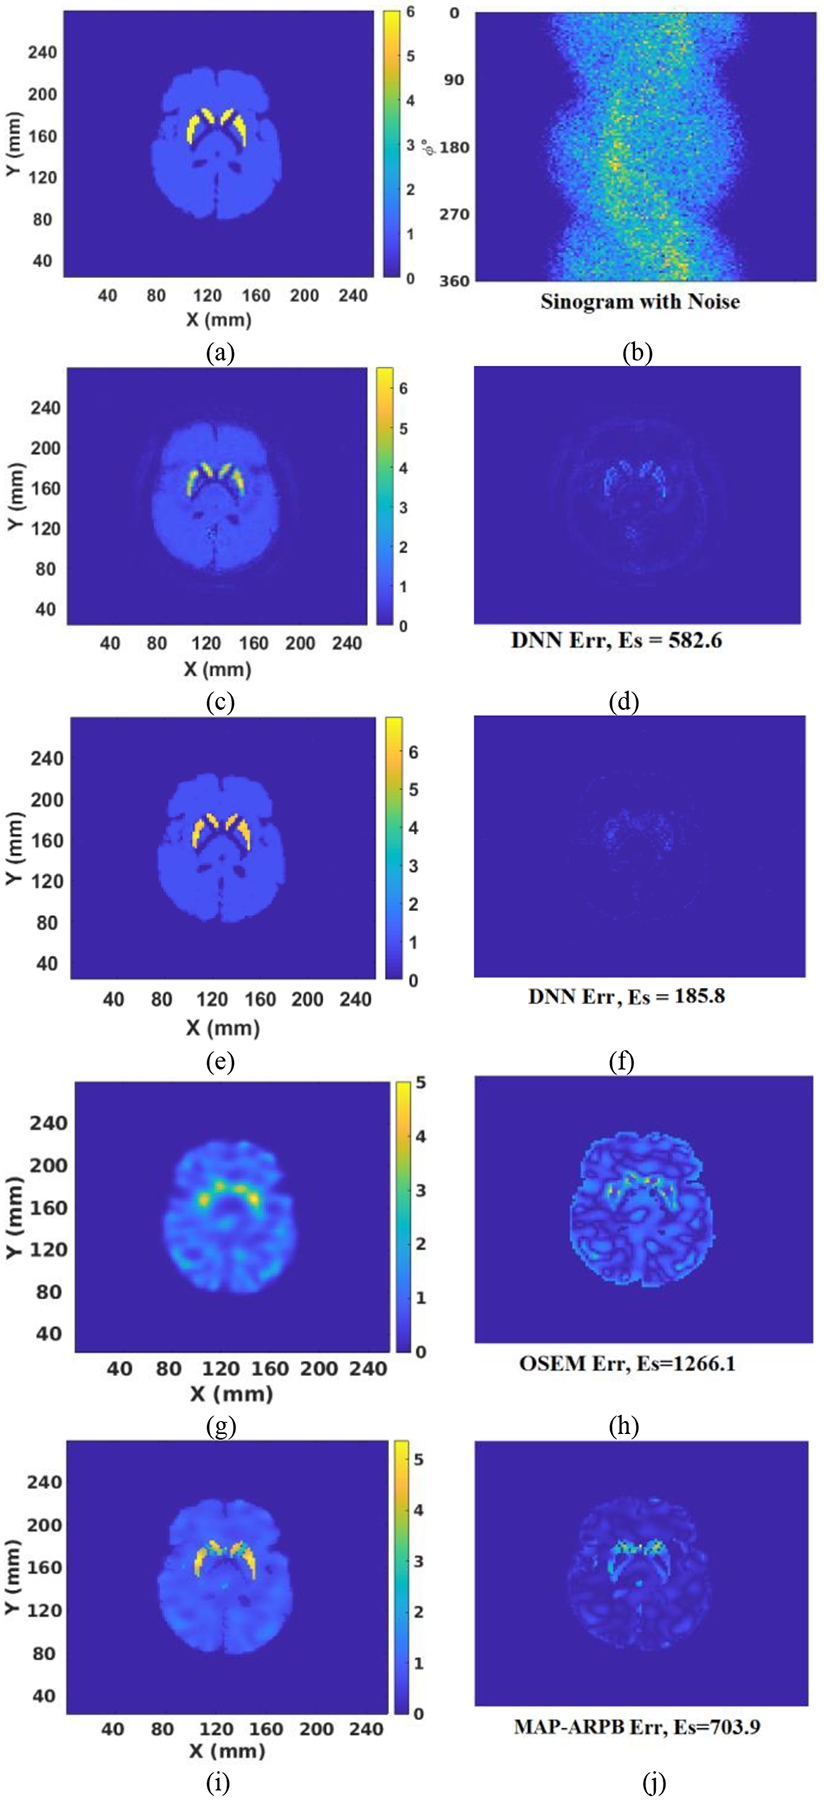
(a) Ground truth activity; (b) sinogram contaminated with noise; (c) Reconstructed image by the DNN trained with noise-free projection data; (d) Error between (a) and (c); (e) Reconstructed image by the DNN trained with noise-added projection data; (f) Error between (a) and (e); (g) Reconstructed image by OS-EM; (h) Error between (a) and (g); (i) Reconstructed image by MAP-ARPB; (j) Error between (a) and (i).
Validation was also conducted by applying 2,000 test examples (projection data with clinic-level noise) and (8) to statistically evaluate the DNN and the retrained DNN. The average Es value for the 2,000 cases was 285.3 for the DNN trained with noise-free data, with a standard deviation of 119.6. The average Es value was only 202.7 for the DNN trained with noisy projection data, with a standard deviation of 55.3. The averaged Es is very similar to the average error (196.7745) obtained from the initial DNN (developed by using noise-free data) testing with noise-free data, demonstrating again that the retrained neural network has overcome the influence of noise.
C. Reconstruction with Sparse (limited view) Projection Data
Next, we investigated the case when fewer projection data are given to DNN. Clinical SPECT data acquisition is often time consuming. A 120-view acquisition for a full 360° SPECT measurement typically takes 30 minutes, with the patient remaining still. If a DNN could successfully reconstruct results when only given 60 views, it would halve imaging time. This approach can also be used to decrease radiation dose while maintaining imaging time. We extracted a portion of the projection data (with noise) from the original database such that a sinogram array was 60 by 128, meaning the projection data was collected by every 6° for a full 360° scan. The attenuation map was still 128 by 128. That form of the dataset was given to the DNN such that necessary changes to the DNN design will only occur in the FC1 layer (neurons). That is an advantage of using a FC layer to accept measurement data. In contrast, when a convolutional layer was instead used to accept data, the whole network architecture would have to be redesigned because of the change of input-data size, since the output size relies on the input-data size in pure convolutional neural networks.
The training scheme was the same as before (Fig. 1). The same datasets (but with reduced views) were used to retrain, validate and test the network. We found the convergence speed of the network using reduced projection data was much slower than when we trained the DNN applying full projection data. In this case we set the learning steps to 100 epochs, which took 3.5 hours on the same workstation as before. We then used the DNN with modified FC1 layer to reconstruct the Zubal brain phantom with the reduced projection data (noisy), with the reconstructed image displayed in Fig. 1(a). Despite training with fewer projection views, the modified DNN produced an image comparable to that when trained with the full dataset. We next investigated even fewer projection views. We extracted arrays in form of 30 by 128 from the original sinograms, meaning the measurement was performed by only 30 views for a full 360° scan (12° spacing between two neighbor views). The modified DNN required training for 150 epochs, which took 5 hours on the same workstation to achieve convergence. The reason that fewer projection data result in longer training time is that the number of equations (60×128 or 30×128) is less than the number of unknowns (128×128) to be solved.
Fig.8.
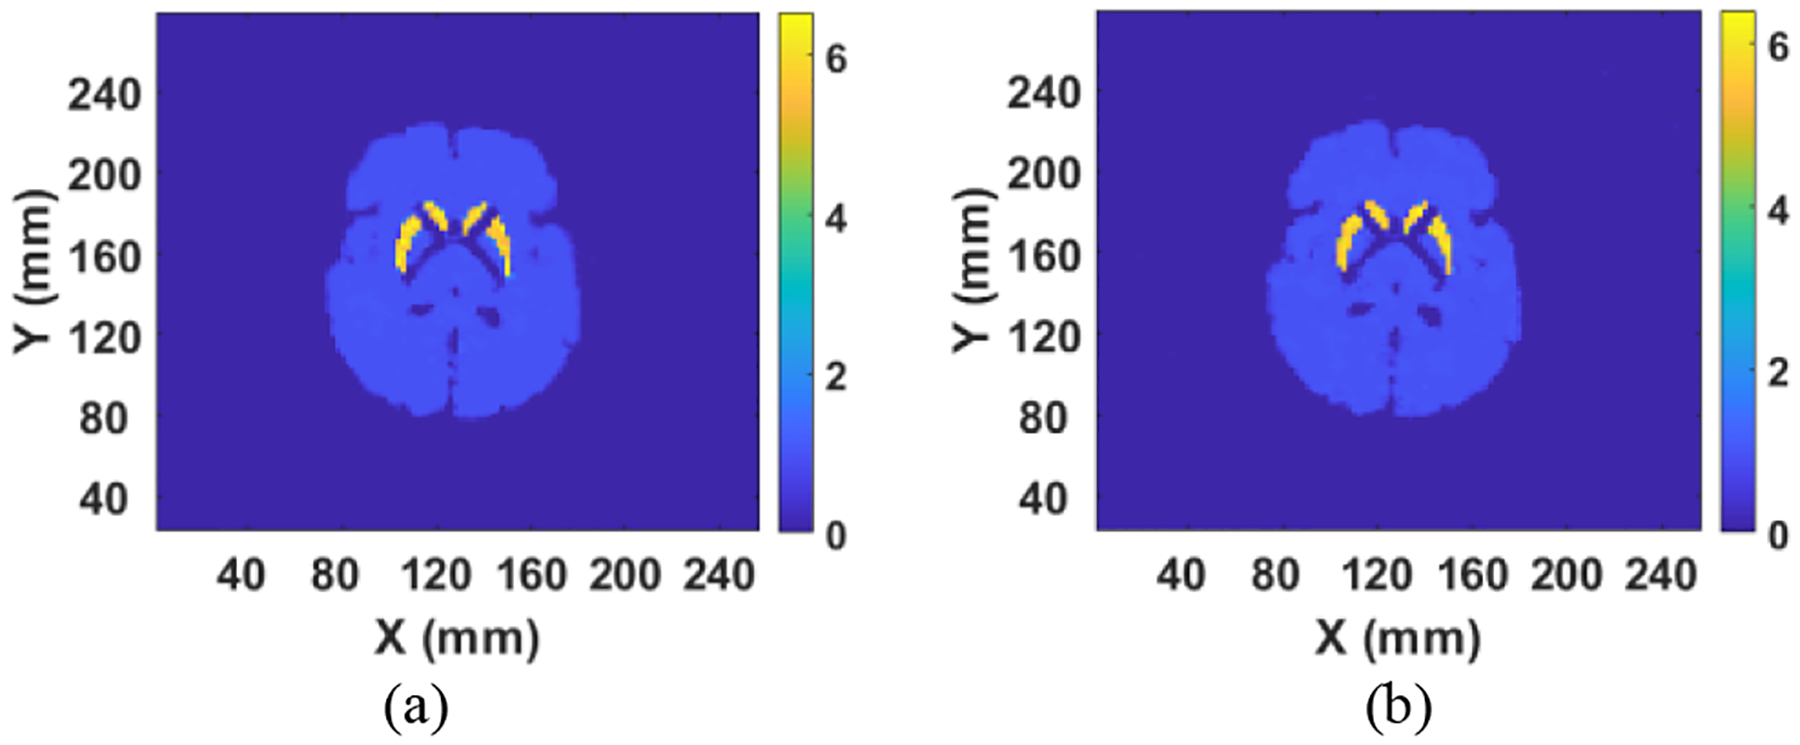
(a) Reconstructed image by using 60 by 128 projection data; and (b) Reconstructed image by using 30 by 128 projection data.
The reconstructed image for the Zubal phantom by the DNN using a 30-by-128 sinogram is presented in Fig. 1(b). The obtained image was still sharper than that from OS-EM (Fig 7 g), even using a full 120-by-128 sinogram for the latter. Comparison of reconstruction error from Fig. 7(e), using full projection data, Fig. 1(a), using 60-by-128 projection data, and Fig. 1(b), using 30-by-128 projection data, is presented in Table III using (8). We show that error in the image increased when reduced projection data were applied in the reconstruction, but they are still less than the OS-EM reconstruction with 120 projection views.
TABLE III.
Reconstruction Error Comparison When Using Different Projection Data Size
| Sinogram Size | Corresponding Figure | Es Value |
|---|---|---|
| 120 × 128 | Fig. 7 (e) | 185.8 |
| 60 × 128 | Fig. 1 (a) | 281.6 |
| 30 × 128 | Fig. 1 (b) | 317.6 |
D. Validation with Patient Data
Finally, data from one patient collected on a Siemens Symbia T16s SPECT system was used to test the performance of our DNN. Note that the patient data had a pixel size of 3.895 mm, which was linearly interpolated to 2 mm for this study to match the input-data size of the DNN. The sinogram is shown in Fig. 9(a). As can be seen, the sinogram is noisy and contains significant scatter. The attenuation map obtained from the CT scan is shown in Fig. 9(b). The patient sinogram and attenuation map were used to reconstruct an image by OS-EM with post-reconstruction filtering and compensation for attenuation and resolution. The result is shown in Fig. 9(c). The patient data were also reconstructed by the DNN trained with noise-added data. That result is shown in Fig. 9(d). The image obtained by DNN demonstrated less noise and had more uniform background uptake than that created by OS-EM with filtering. However, the reconstructed striatum was somehow elongated in the X direction in the DNN image, which is due to the scatter effect that has not been considered in our simulation and network training yet. Therefore, further improvement can be expected if scatter is included in our future DNN method investigation.
Fig. 9.
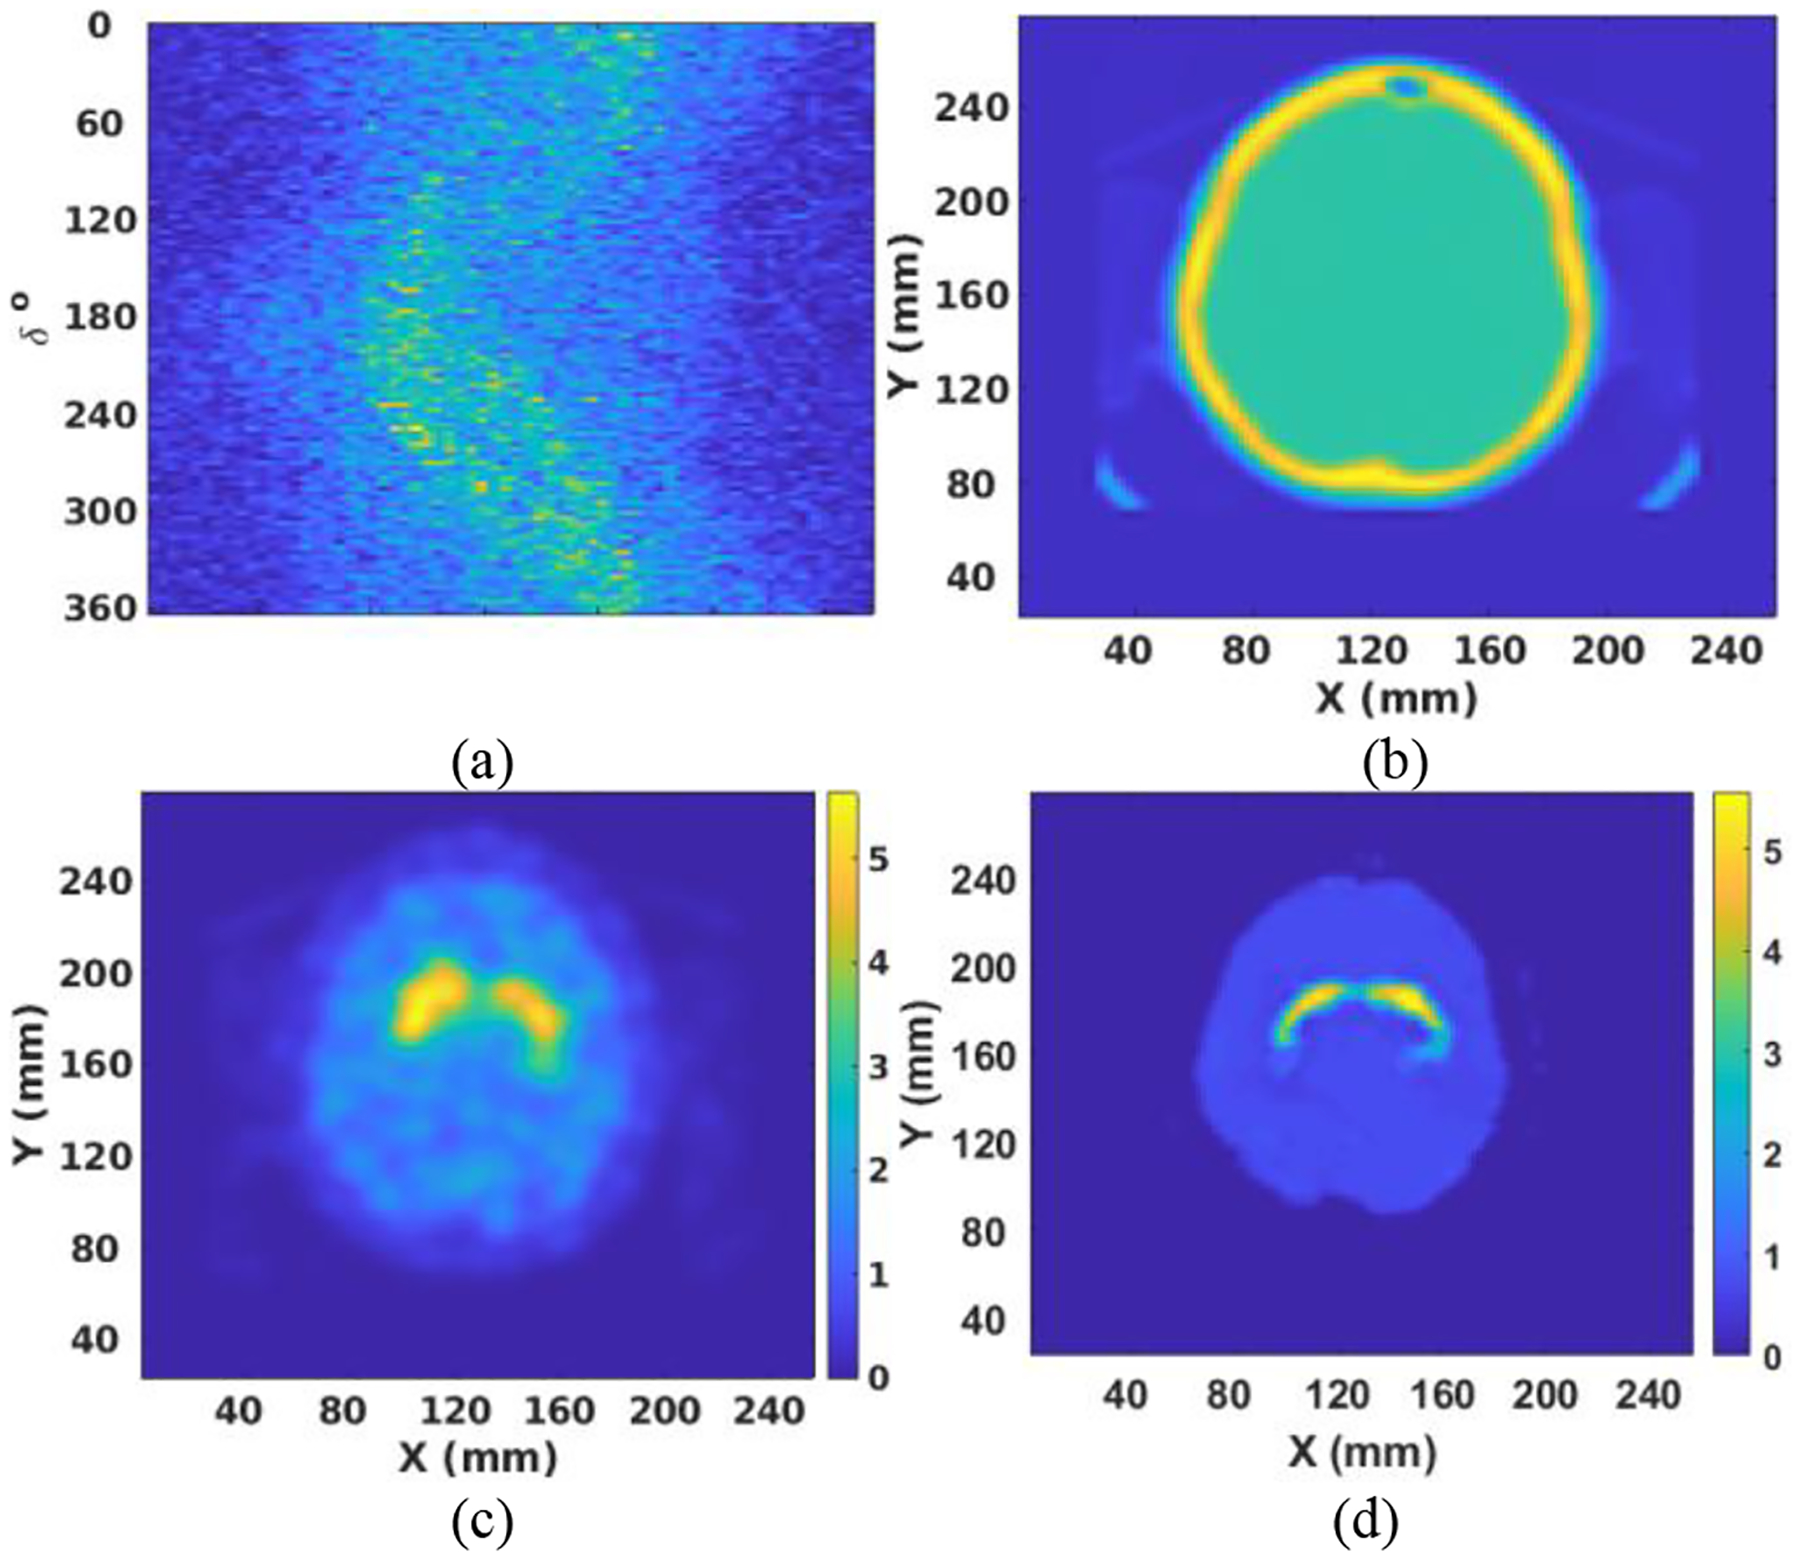
(a) The sinogram after interpolation; (b) The attenuation map after 2-D interpolation; (c) Reconstructed image by OS-EM with filtering; (d) Reconstructed image by DNN trained with noise-added projection data.
5. Discussion
We present a DNN developed to reconstruct SPECT images directly from projection data. The DNN implemented two FC layers to reconstruct a basic profile by using the input projection data, and the result as well as an attenuation map was then sent to the 2-D convolutional layers for attenuation compensation and image optimization. One advantage of the proposed network design is that it requires very small change to network architecture when input-data size is changed (e.g., sparse projection data input).
The reconstruction result was compared with the result obtained by OS-EM and MAP algorithms, with superior images achieved by the DNN system. The DNN was retrained by using projection data with noise included. Results indicated that the retrained DNN also learned to filter noise in the projection data. Interestingly, when the retrained DNN was tested by projection data with lower or noise-free data, the result was not significantly improved from Fig. 7e, meaning that the image quality was relatively stable and was not much affected by the noise level in the projection data. The DNN was also tested by using clinical data, and performance was compared to the result achieved from OS-EM with post-reconstruction filtering. Those results further demonstrated the superiority of the DNN to conventional reconstruction methods.
Scatter was not included in the simulation and training of the DNN. Nevertheless, as demonstrated in Fig. 9, the DNN still produced images superior to OS-EM reconstruction with post-reconstruction filtering. For future work, we will include scatter events and other physics factors in the simulation and DNN design such that performance can be further improved. We will also further validate the DNN with more patient data using task-based methods.
6. Conclusions
We have created a DNN that can be used to reconstruct activity images given the projection data and the corresponding attenuation map. The DNN is robust to noise and can produce images with higher resolution and more accurate quantification than reconstruction with OS-EM. The DNN also allowed use of reduced projection views while still producing high quality images, enabling reduction in imaging time or radiation dose.
Acknowledgement
The authors are thankful to the National Institutes of Health (NIH) for support through R01NS094227 and U01CA140204.
Footnotes
Declaration of Competing Interest
The authors declare that they have no conflicts of interest that could influence the work reported in this paper.
References
- [1].Chen J et al. , “Onset of left ventricular mechanical contraction as determined by phase analysis of ECG-gated myocardial perfusion SPECT imaging: development of a diagnostic tool for assessment of cardiac mechanical dyssynchrony,” J. Nucl. Cardiology, vol. 12, no. 6, pp. 687–695, 2005. [DOI] [PubMed] [Google Scholar]
- [2].Du Y, Tsui BMW, and Frey EC, “Model-based compensation for quantitative I-123 brain SPECT imaging,” Phys. Med. Biol, vol. 51, no. 5, pp. 1269–1282, 2006. [DOI] [PubMed] [Google Scholar]
- [3].Mabrouk R, Chikhaoui B, and Bentabet L, “Machine Learning based classification using clinical and DaTSCAN SPECT imaging features: a study on Parkinson’s disease and SWEDD,” IEEE Trans. Rad. Plasma Med. Sc, vol 3, no. 2, pp. 170–177, 2019. [Google Scholar]
- [4].Perri M, et al. , “Octreo-SPECT/CT imaging for accurate detection and localization of suspected neuroendocrine tumors,” The Quarterly J. of Nucl. Med. and Molecular Imag, vol. 52, no. 4, pp. 323–333, 2008. [PubMed] [Google Scholar]
- [5].Shepp LA and Vardi Y, “Maximum likelihood reconstruction for emission tomography,” IEEE Trans. Med Imag, vol. 1, no. 2, pp. 113–122, 1982. [DOI] [PubMed] [Google Scholar]
- [6].Tsui BMW et al. , “Correction of nonuniform attenuation in cardiac SPECT imaging,” J. Nucl. Med, vol. 30, no.4, pp. 497–507, 1989. [PubMed] [Google Scholar]
- [7].Hudson HM, Hutton BF, Larkin R, and Walsh C, “Investigation of multiple energy reconstructions in SPECT using MLEM,” J. Nucl. Med, vol. 37, no. 5, pp. 746, 2006. [Google Scholar]
- [8].Lee H, Lee J, Kim H, Cho B, and Cho S, “Deep-neural-network-based sinogram synthesis for sparse-view CT image reconstruction,” IEEE Trans. Rad. Plasma Med. Sc, vol 3, no. 2, pp. 109–119, 2019. [Google Scholar]
- [9].Hudson HM and Larkin RS, “Accelerated image reconstruction using ordered subsets of projection data,” IEEE Trans. Med Imag, vol. 13, no.4, pp. 601–609, 1994. [DOI] [PubMed] [Google Scholar]
- [10].Hudson HM, Hutton BF, and Larkin R, “Accelerated EM reconstruction using ordered subsets,” J. Nucl. Med, vol. 33 (abstract) pp. 960, 1992. [Google Scholar]
- [11].Fessler JA, “Penalized weighted least squares image reconstruction for positron emission tomography,” IEEE Trans. Med. Imag, vol. 13, no. 2, 290–300, 1994. [DOI] [PubMed] [Google Scholar]
- [12].Lalush DS and Tsui BMW, “A generalized Gibbs prior for maximum a posteriori reconstruction in SPECT,” Phys. Med. Biol, vol. 38, no. 6, pp. 729–741, 1993. [DOI] [PubMed] [Google Scholar]
- [13].Green PJ, “Bayesian reconstructions from emission tomography data using a modified EM algorithm,” IEEE Trans. Med. Imag, vol. 9, no. 1, pp. 84–93, 1990. [DOI] [PubMed] [Google Scholar]
- [14].Zhu B, Liu JZ, Cauley SF, Rosen BR, and Rosen MS, “Image reconstruction by domain-transform manifold learning,” Nature, vol. 555, pp. 487–495, 2018. [DOI] [PubMed] [Google Scholar]
- [15].Yang G et al. , “DAGAN: deep de-aliasing generative adversarial networks for fast compressed sensing MRI reconstruction,” IEEE Trans. Med. Imag, vol. 37, no. 6, pp. 1310–1321, 2018. [DOI] [PubMed] [Google Scholar]
- [16].Quan TM, Nguyen-Duc T, and Jeong W, “Compressed sensing MRI reconstruction using a generative adversarial network with a cyclic loss,” IEEE Trans. Med. Imag, vol. 37, no. 6, pp. 1488–1497, 2018. [DOI] [PubMed] [Google Scholar]
- [17].Han Y and Ye JC, “Framing U-net via deep convolutional framelets: application to sparse-view CT,” IEEE Trans. Med. Imag, vol. 37, no. 6, pp. 1418–1429, 2018. [DOI] [PubMed] [Google Scholar]
- [18].Chen H, et al. , “LEARN: learned experts’ assessment-based reconstruction network for sparse-data CT,” IEEE Trans. Med. Imag, vol. 37, no. 6, pp. 1333–1347, 2018. [DOI] [PMC free article] [PubMed] [Google Scholar]
- [19].Gupta H, Jin KH, Nguyen HQ, McCann MT, and Unser M, “CNN-based projected gradient descent for consistent CT image reconstruction,” IEEE Trans. Med. Imag, vol. 37, no. 6, pp. 1440–1453, 2018. [DOI] [PubMed] [Google Scholar]
- [20].Hwang D et al. , “Improving the accuracy of simultaneously reconstructed activity and attenuation maps using deep learning,” J. Nucl. Med, vol. 59, no. 10, pp. 1624–1629, 2018. [DOI] [PubMed] [Google Scholar]
- [21].Hwang D et al. , “Generation of PET attenuation map for whole-body time-of-flight 18F-FDG PET/MRI using deep neural network trained with simultaneously reconstructed activity and attenuation maps,” J. Nucl. Med, vol. 60, no. 8, pp. 1183–1189, 2019. [DOI] [PMC free article] [PubMed] [Google Scholar]
- [22].Kim K et al. , “Penalized PET reconstruction using deep learning prior and local linear fitting,” IEEE Trans. Med. Imag, vol. 37, no. 6, pp.1478–1487, 2018. [DOI] [PMC free article] [PubMed] [Google Scholar]
- [23].Dietze MMA, Branderhorst W, Kunnen B, Viergever MA, and de Jong HWAM, “Accelerated SPECT image reconstruction with FBP and an image enhancement convolutional neural network,” EJNMMI Phys, vol. 6, no. 14, pp. 1–12, 2019. [DOI] [PMC free article] [PubMed] [Google Scholar]
- [24].Winogrodzka A, et al. , “[I-123]FP-CIT SPECT is a useful method to monitor the rate of dopaminergic degeneration in early-stage Parkinson’s disease,” J. Neural Transm,vol. 108, no. 8–9, pp. 1011–1019, 2001. [DOI] [PubMed] [Google Scholar]
- [25].Zubal IG, Harrell CR, Smith EO, Rattner Z, Gindi G, and Hoffer PB, “Computerized three-dimentional segmented human anatomy,” Medical Physics, vol. 21, no. 2, pp. 299–302, 1994. [DOI] [PubMed] [Google Scholar]
- [26].Shao W and Du Y, “SPECT image reconstruction by deep learning using a two-step training method,” J. Nucl Med, vol. 60, no. 1, pp. 1353, 2019. [Google Scholar]
- [27].Zeng GL, Gullberg GT, Tsui BMW, Terry JA, “Three-dimensional iterative reconstruction algorithms with attenuation and geometric point response correction,” IEEE Trans. Nucl. Sci, vol. 38, no. 2, pp. 693–702, 1991. [Google Scholar]
- [28].He K, Zhang X, Ren S, and Sun J, “Delving deep into rectifiers: Surpassing human-level performance on imagenet classification,” Proceed. IEEE Inter. Conf. Computer Vision, pp. 1026–1034, 2015. [Google Scholar]
- [29].Frey EC and Tsui BMW, “Collimator-detector response compensation in SPECT,” Quantitative Anal. Nucl. Med. Imag pp. 141–166, 2006. [Google Scholar]
- [30].Baete K, Nuyts J, Paesschen WV, et al. ”Anatomical-based FDG-PET reconstruction for the detection of hypo-metabolic regions in epilepsy,” IEEE Trans.Med.Imag, vol.23, no.4, pp.510–519, 2004. [DOI] [PubMed] [Google Scholar]
- [31].Mameuda Y and Kudo H, “New anatomical-prior-based image reconstruction method for PET/SPECT,” Proceed. IEEE Nucl. Sci. Symposium, vol, 6, pp. 1–12, 2007. [Google Scholar]


