Figure 5.
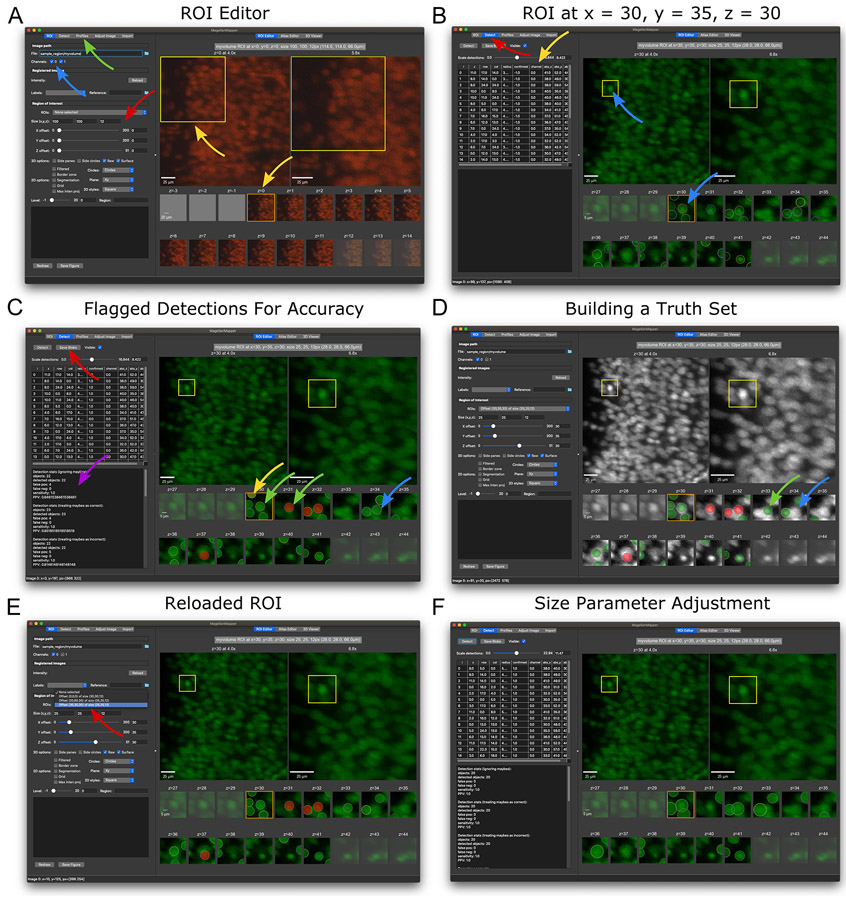
Detecting and annotating nuclei in the ROI Editor. (A) The main graphical interface for MagellanMapper shows options for defining and visualizing a region of interest (ROI) on the left, with the ROI displayed on the right. The ROI settings (red arrow) can be entered in the size boxes and offset sliders. Below the ROI selection controls are various 2D and 3D viewing options, and further down are figure redraw and save controls. Channels can be toggled (blue arrow), and profiles changed in the Profiles tab (green arrow). In the right panel, the top row shows overview plots starting with the original image on the left and progressively zooming into the ROI highlighted by a yellow box with each successive plot (top yellow arrow), with. As a volumetric image, the full image contains multiple z-planes. The z-planes within the ROI are shown as smaller plots in the bottom rows, labeled by the corresponding absolute z-plane number (starting with z = 0). Scrolling the mouse or pressing arrow keys will scroll the original image’s z-plane and shift the orange box to the corresponding ROI z-plane (bottom yellow arrow). (B) A new ROI with different offset and size parameters as shown in the left panel settings. Whereas the previous view overlaid all channels, only the first channel was selected here. Selecting the “Detect” tab (red arrow) and pressing the “Detect” button will perform 3D blob detection to identify objects such as nuclei. The detected locations appear as circles in the ROI plots, with each circle positioned at the detected center of the given blob. Notice how the bright nucleus in the middle of the yellow box corresponds to a detection shown in the z = 30 ROI plot (blue arrows). The table shows the coordinates of each circle (yellow arrow). (C) Annotating detections based on accuracy. These circles can be repositioned, added, deleted, or flagged to assess detection accuracy and annotate ground truth sets to train the detector. Clicking on circles changes their color to flag them as correct (green circle, green arrow) or incorrect (red circle, red arrow). A yellow flag (yellow circle, yellow arrow) can be used for ambiguous detections or nuclei. Missing detections can be added by Ctrl-clicking on the desired location. After saving annotations (red arrow), detection statistics are shown in the feedback panel (purple arrow). (D) An example of further annotating the ROI to build ground truth by shifting, resizing, and copying/cutting/pasting circles. An alternate colormap assists with contrast for more precise annotation. Note the circle cut from z = 33 (blue arrows in parts C and D) and pasted into the next plane (z = 34, green arrow) to match the center of the nucleus along the z-axis. (E) After saving the ROI, the ROI appears in a dropdown box (red arrow), which can be selected to restore the ROI after shifting to a different ROI or re-opening MagellanMapper. (F) Cell detection parameter adjustment. Changing the minimum and maximum detection sizes can impact detection accuracy. In this case, the detected sizes of each nuclei are somewhat large, but the number of duplicate detections of the same nuclei decreases.

