
Figure 3.
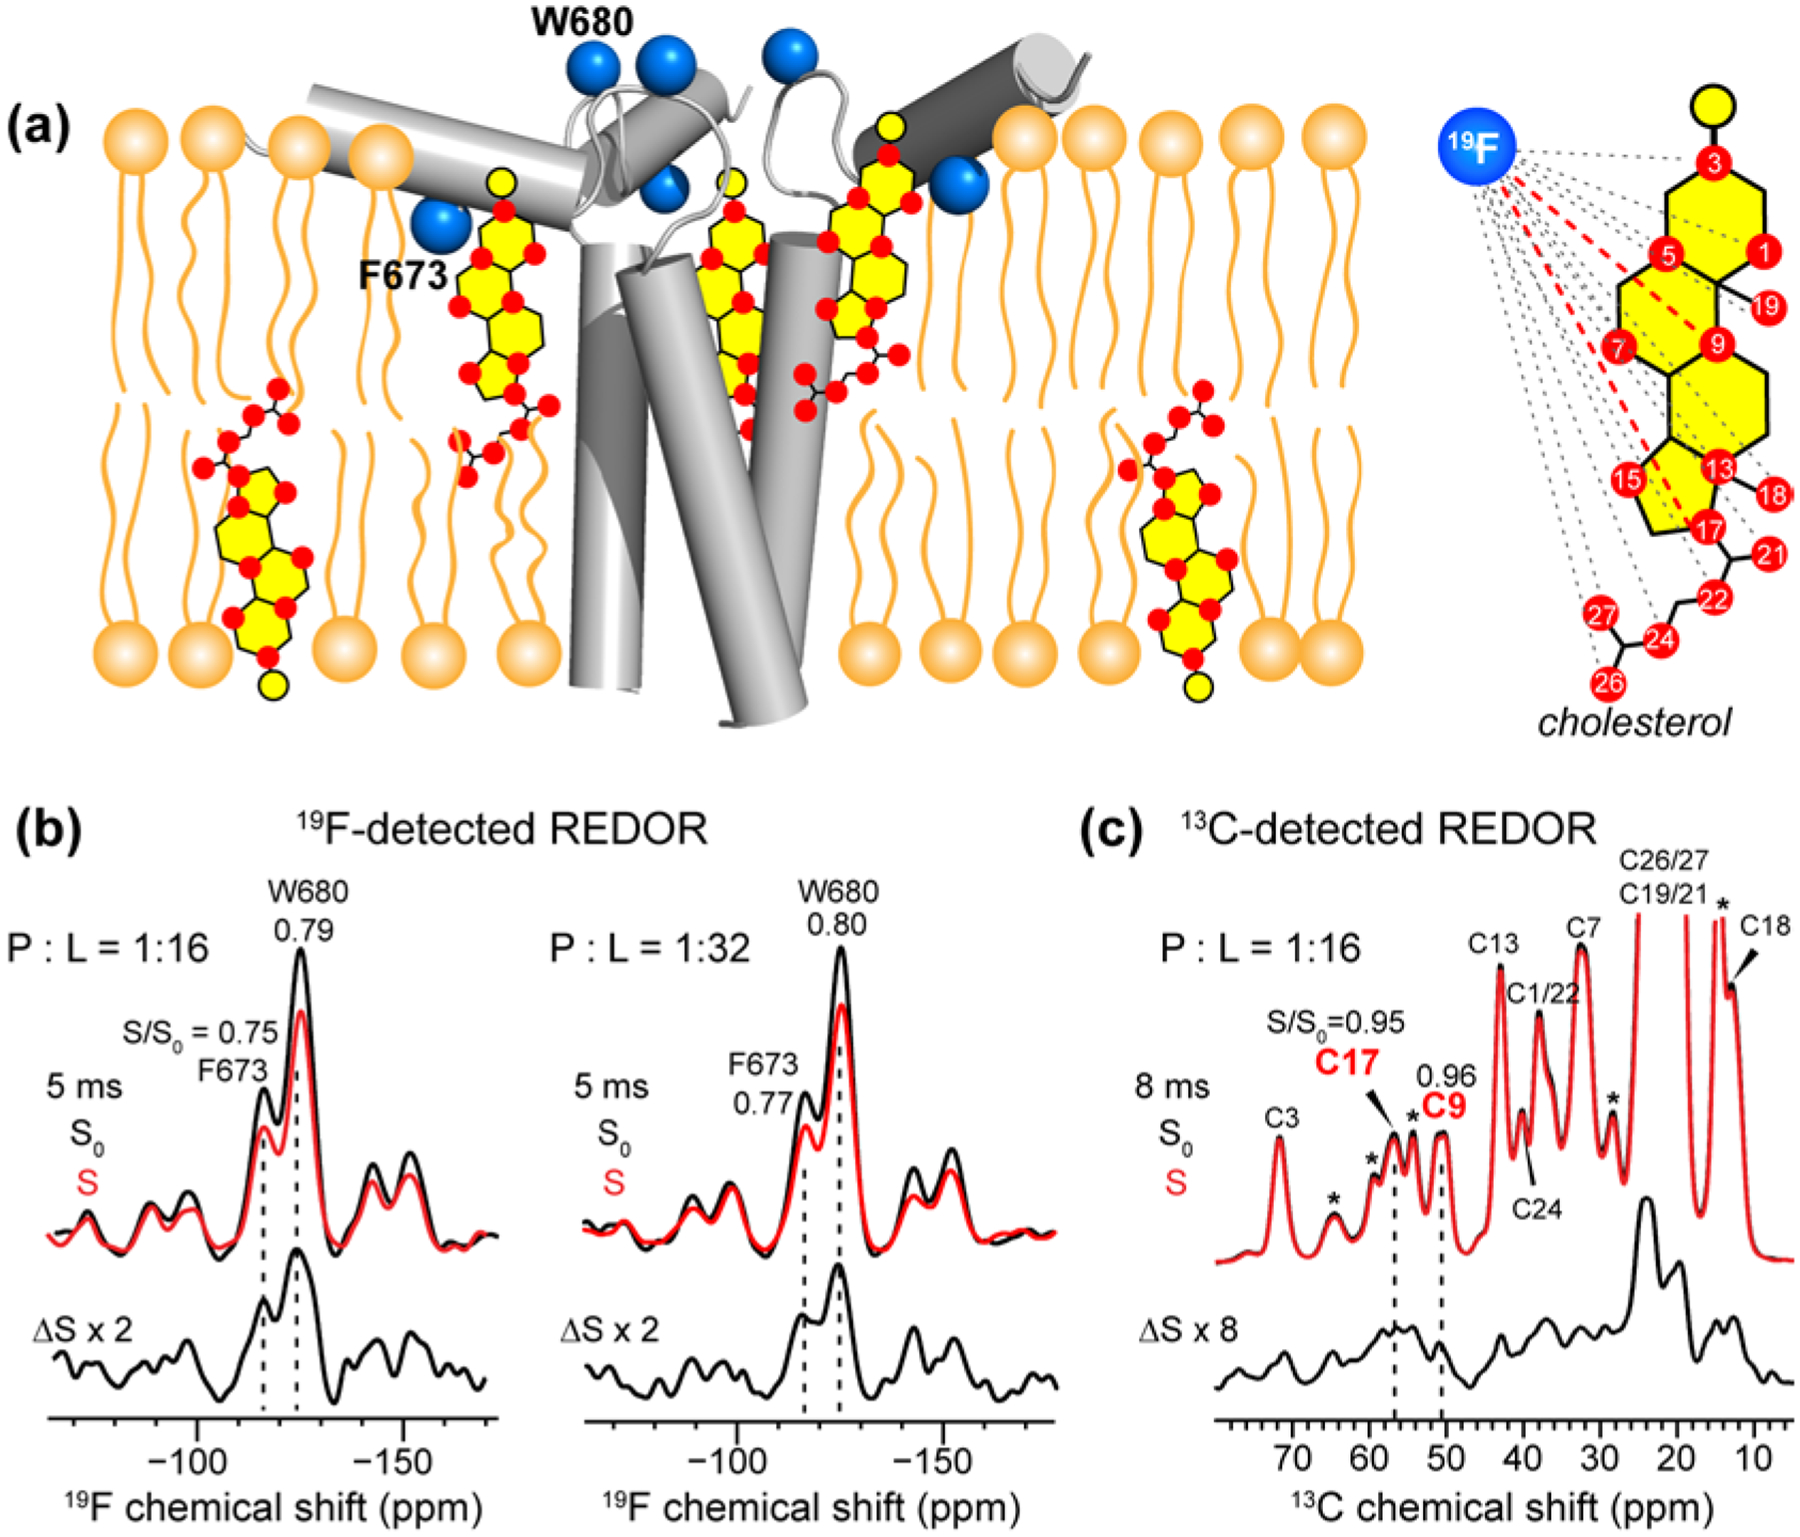
19F-detected and 13C-detected 13C-19F REDOR spectra to determine cholesterol-gp41 proximity in the VM+ membrane. (a) Schematic of fluorinated MPER-TMD trimer in VM+ membranes. 1-13C CHOL with 13C-labeled sites is illustrated. Each fluorine is coupled to multiple CHOL carbons. (b) Representative 19F-detected REDOR spectra, measured at 238 K under 10 kHz MAS. At 5 ms mixing, significant intensity differences are observed between the control (S0) and dephased (S) spectra, indicating that F673 and W680 are close to 1-13C CHOL. Two samples with protein/lipid molar ratios of 1 : 16 and 1 : 32 gave similar results. The S/S0 values are indicated for the two 19F peaks. (c) Representative 13C-detected REDOR spectra, measured at 238 K under 10 kHz MAS. At 8 ms mixing, clear intensity differences between the S0 and S spectra are observed, indicating that some of the cholesterol molecules are in molecular contact with the peptide. The dephasing values S/S0 for C17 and C9 are indicated. Asterisks indicate lipid natural abundance signals, some of which partially overlap with the cholesterol peaks.