Figure 6:

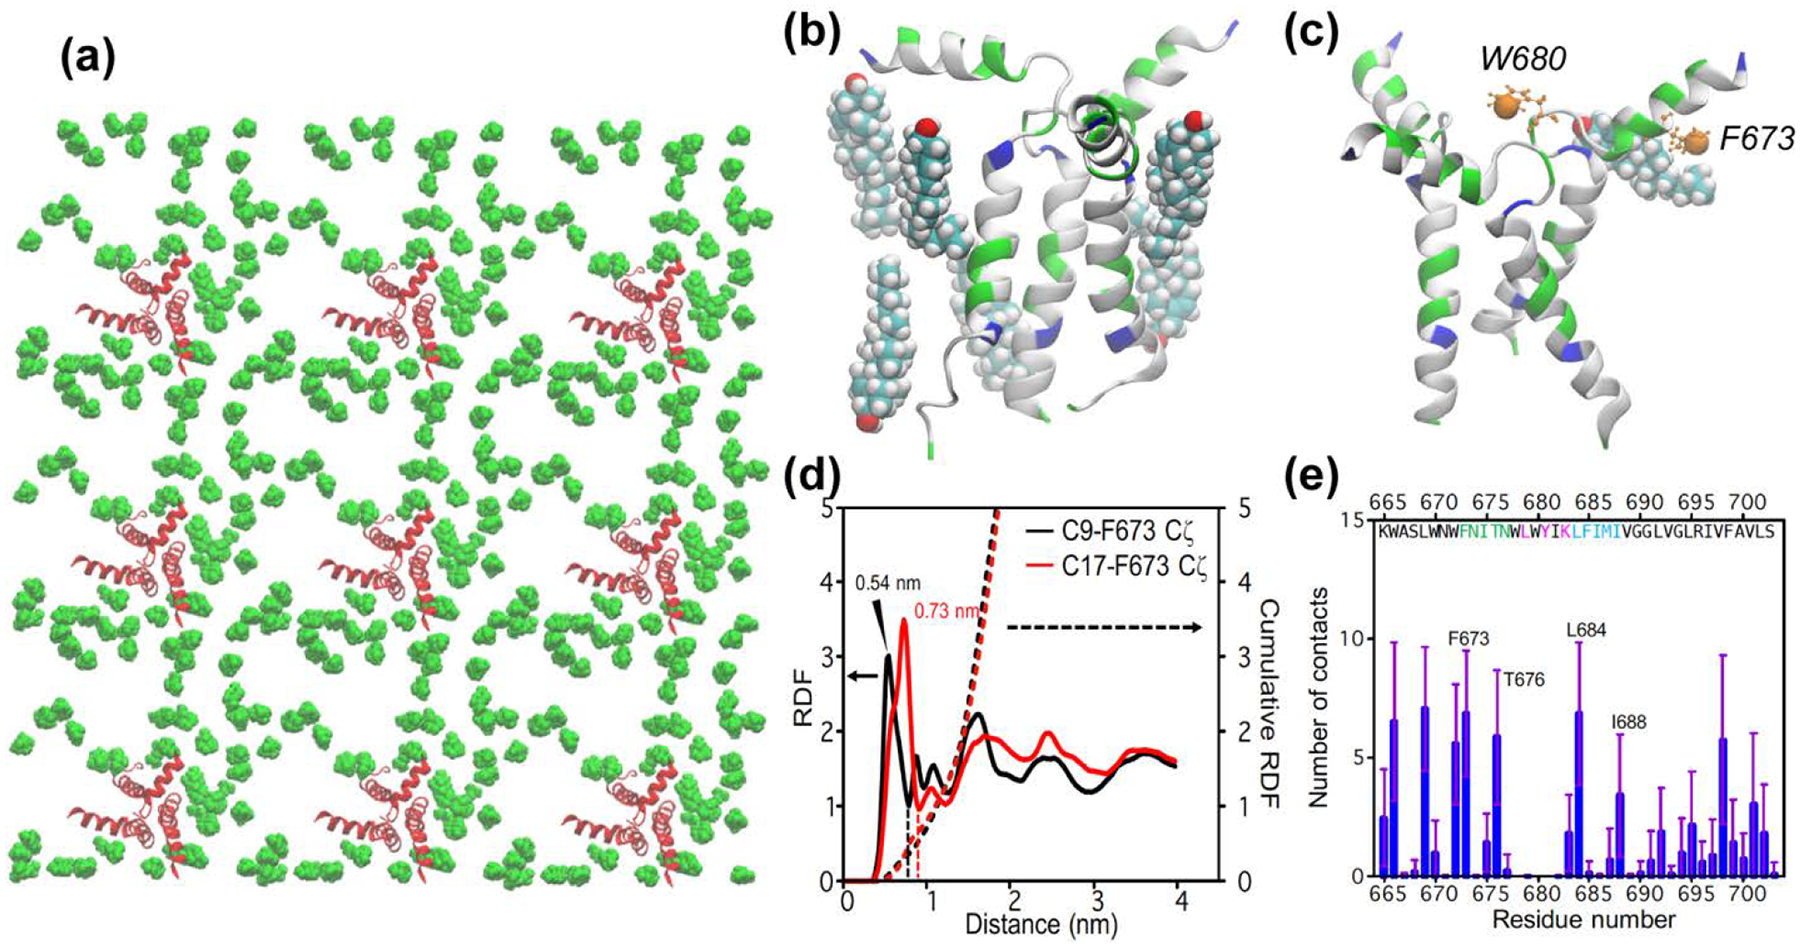
All-atom MD simulation of cholesterol-gp41 contacts at low protein concentrations (P : L : C = 1 : 64 : 28) (a) Top view of the equilibrated lipid membrane, showing only protein (red) and cholesterol (green) molecules in the upper leaflet. (b) A representative structure of cholesterol molecules within 3 Å of the MPER-TMD trimer. (c) A representative snapshot showing the location of W680 Cζ3 and F673 Cζ (orange spheres) in the MPER-TMD structure. Also shown is a bound cholesterol whose C9 atom is within 7.5 Å of F697 Cζ. (d) Radial distribution functions (solid lines) and cumulative sums (dotted lines) of cholesterol C9 and C17 from F673 Cζ. The value of the cumulative RDF up to the first minimum (dashed lines) for C9 and C17 is averaged to give the number of bound cholesterols per gp41 monomer, which is 0.52. Multiplied by a factor of 3, this gives a stoichiometry of 1.5 cholesterols near MPER for each gp41 trimer. (e) Number of cholesterol atoms in close contact with each MPER-TMD residue.
