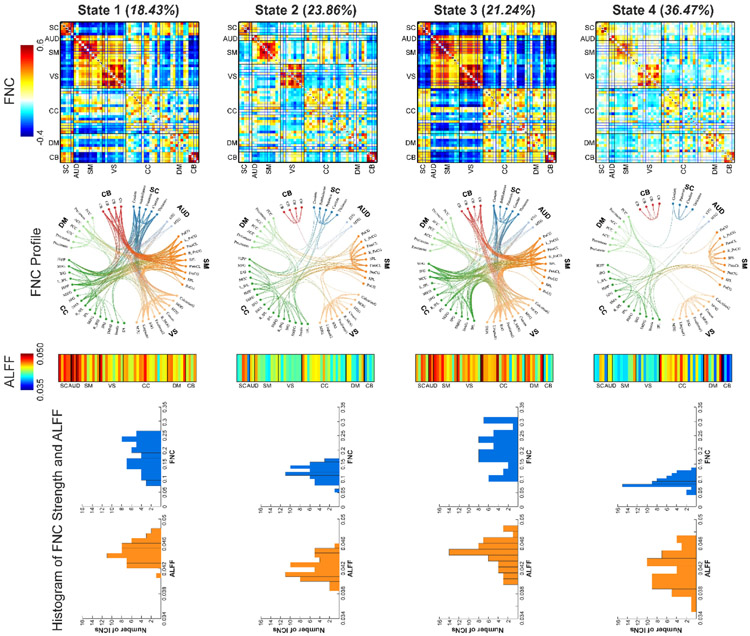
Figure 1.
Findings of dynamic brain activity-connectivity states. Four brain states are identified. First row: the FNC patterns of brain states. Two states have strong within-domain connectivity and negative between-domain connectivity patterns and two states have weak and sparse connectivity patterns. Second row: top 200 FNC with connectivity strength > 0.25 in each state, representing the strongest functional-relationships between brain regions (absolute value). Each color represents one of the seven domains. Third row: the ALFF patterns of brain state. Two states have high ALFF and two states have low ALFF. Fourth row: the histogram of FNC strength and ALFF of ICNs. FNC strength is calculated as the average FNC between a given ICN and the other ICNs. Functional network connectivity, FNC; the amplitude of low-frequency fluctuations, ALFF; intrinsic connectivity networks (ICNs).

