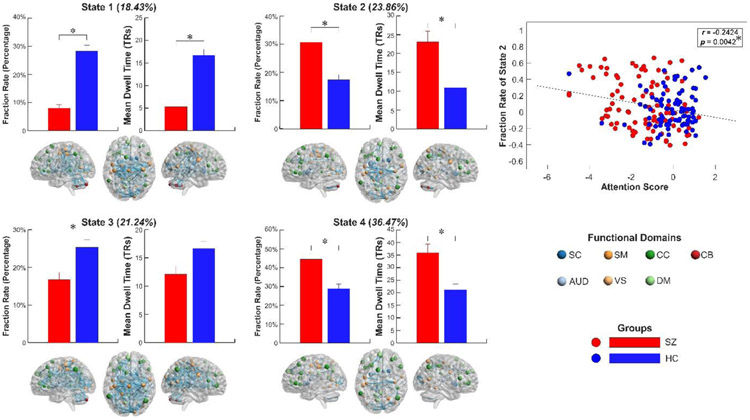
Figure 2.
Group differences in occurrence and its association with cognitive performance. Bars represent the mean of occurrences and error bars represent the standard deviation of mean. SZ patients have significantly decreased FRA and MDT in the “strong” activity-connectivity states (state 1 and state 3) and increased FRA and MDT in the “weak” states (state 2 and state 4). The centroid patterns of states are displayed, with node size representing the ALFF and edge size representing the connectivity value. The FRA of state 2 is negatively correlated with the performance of attention. schizophrenia, SZ; fraction rate, FRA; mean dwell time, MDT; the amplitude of low-frequency fluctuations, ALFF.

