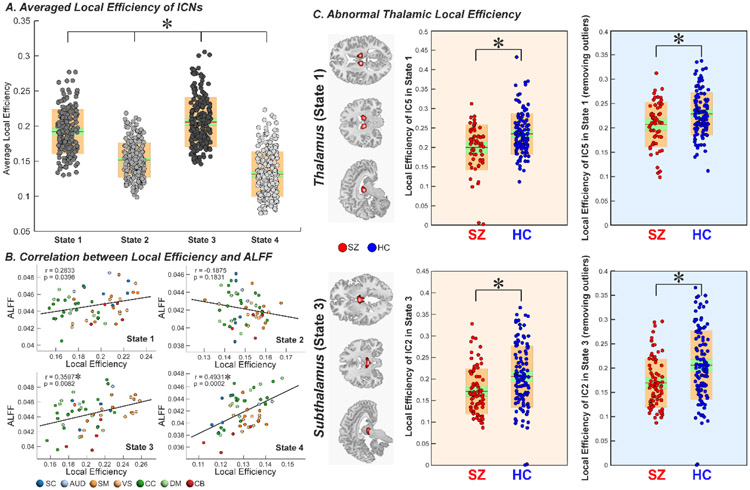
Figure 4.
Graph measure of dynamic activity-connectivity states. A. Average local efficiency across ICNs of each brain activity-connectivity state is displayed using boxplots. Each dot represents an individual’s value and the color represents the efficiency level (Darker → higher efficiency). B. The correlation coefficient between local efficiency and ALFF across ICNs of each state are shown using scatter plots, with different colors representing different functional domains. C. Group comparison in local efficiency of thalamus and subthalamus are displayed using boxplots. SZ patients have decreased efficiency in thalamus and subthalamus in the “high-efficiency” states. Asterisks indicate significance after FDR correction. Intrinsic connectivity network, ICN; the amplitude of low-frequency fluctuation, ALFF; false discovery rate, FDR.

