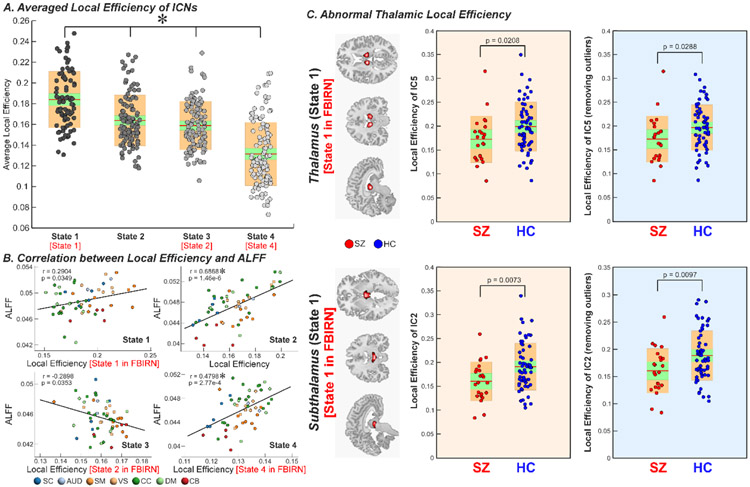
Figure 5.
Replication of graph measure using the COBRE dataset. A. Average local efficiency across ICNs of each brain activity-connectivity state is displayed using boxplots. Brain states show similar efficiency difference (state 1 [state 1 in FBIRN] > state 3 [state 2 in FBIRN] > state 4 [state 4 in FBIRN]). B. The correlation coefficient between local efficiency and ALFF across ICNs of each state are shown using scatter plots, with different colors representing different functional domains. State 1 and 4 which match state 1 and 4 in FBIRN dataset show similar positive efficiency-ALFF correlation while state 3 which matches state 2 in FBIRN shows negative efficiency-ALFF correlation. C. Group comparison in local efficiency of thalamus and subthalamus are displayed using boxplots. SZ patients have decreased efficiency in thalamus and subthalamus in state 1, which is a high-efficiency state. Intrinsic connectivity network, ICN; the amplitude of low-frequency fluctuation, ALFF.

