Figure 3.

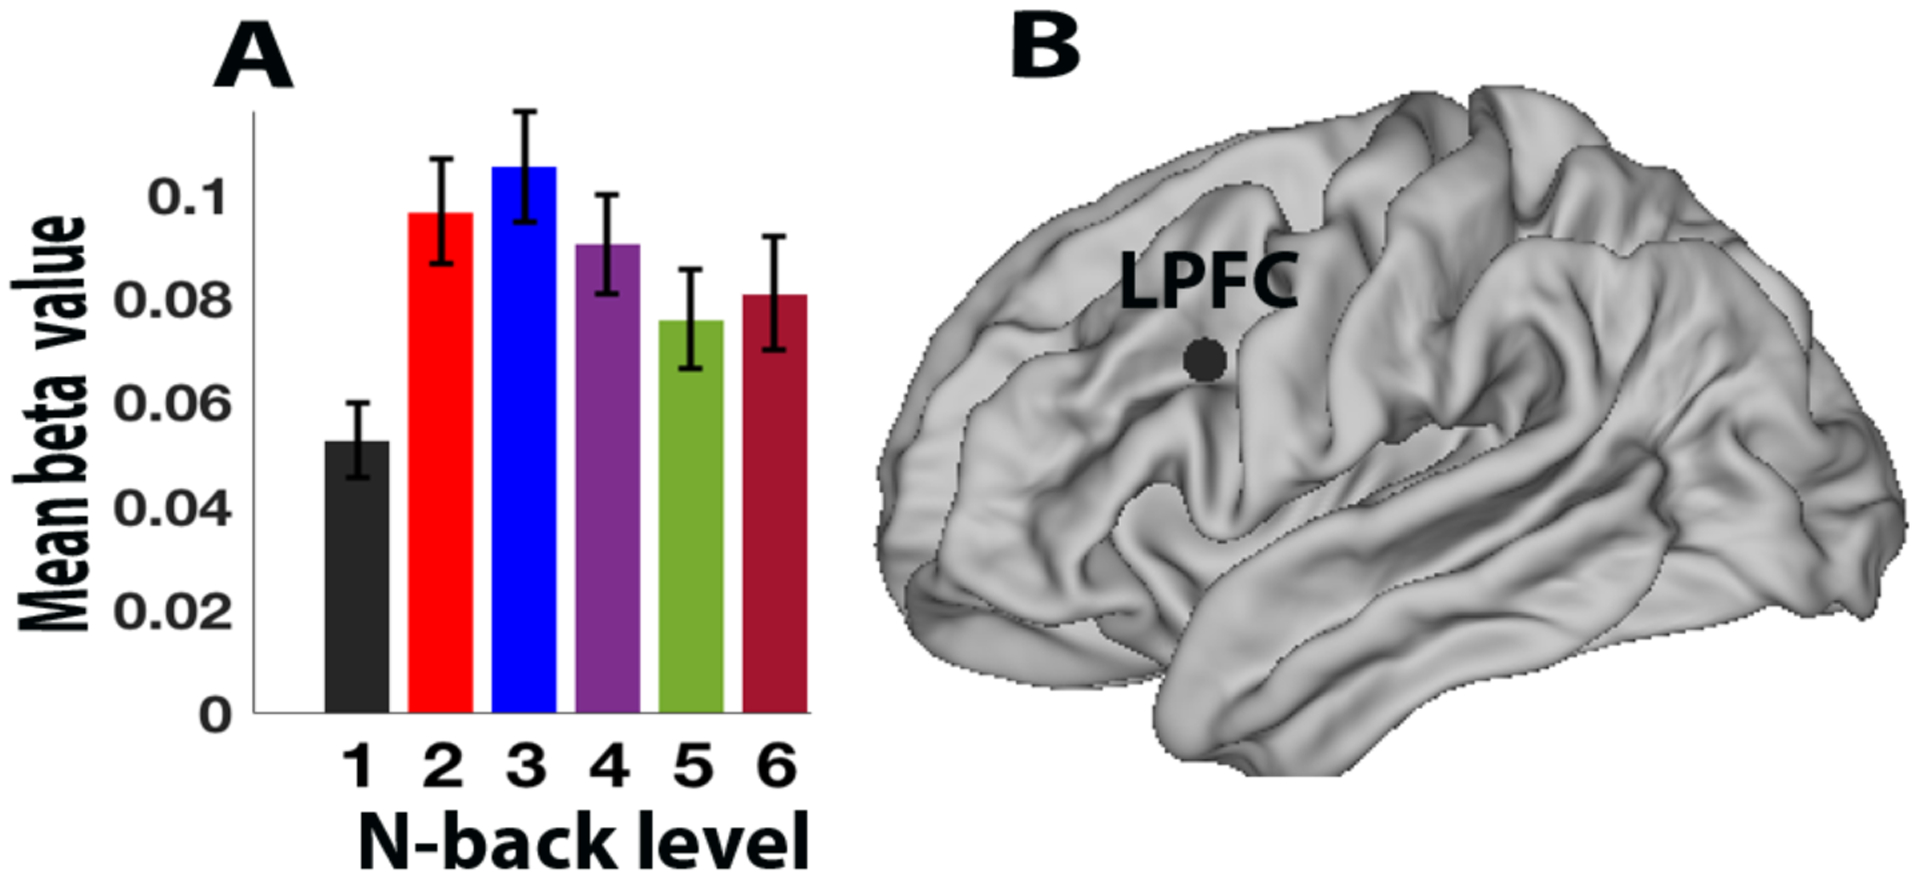
Bar plot of N-back activity (beta parameter), mean over all participants by load level, in (A) LPFC, (B) Anatomical location the left LPFC region from Cole et al. (2012). Error bars indicate standard error of the mean.

Bar plot of N-back activity (beta parameter), mean over all participants by load level, in (A) LPFC, (B) Anatomical location the left LPFC region from Cole et al. (2012). Error bars indicate standard error of the mean.