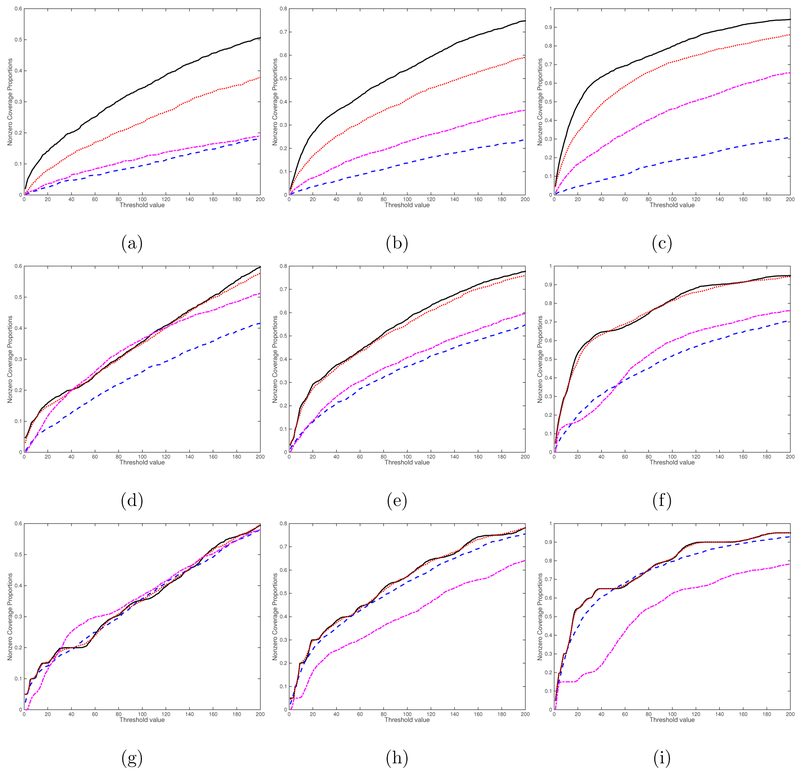
Figure 4:
Screening simulation results for the case (, sn) = (1, 2000): the curves of percentage of the average true nonzero coverage proportion. The black solid, blue dashed, red dotted, and purple dashed dotted lines correspond to the rank-one screening, the L1 entrywise norm screening, the Frobenius norm screening, and the global Wald test screening, respectively. Panels (a)-(i) correspond to (n, ps, qs) = (100, 4, 4), (200, 4, 4), (500, 4, 4), (100, 8, 8), (200, 8, 8), (500, 8, 8), (100, 16, 16), (200, 16, 16), and (500, 16, 16), respectively.

