
Extended Data Fig. 6. Serum proteins areas under the curves.
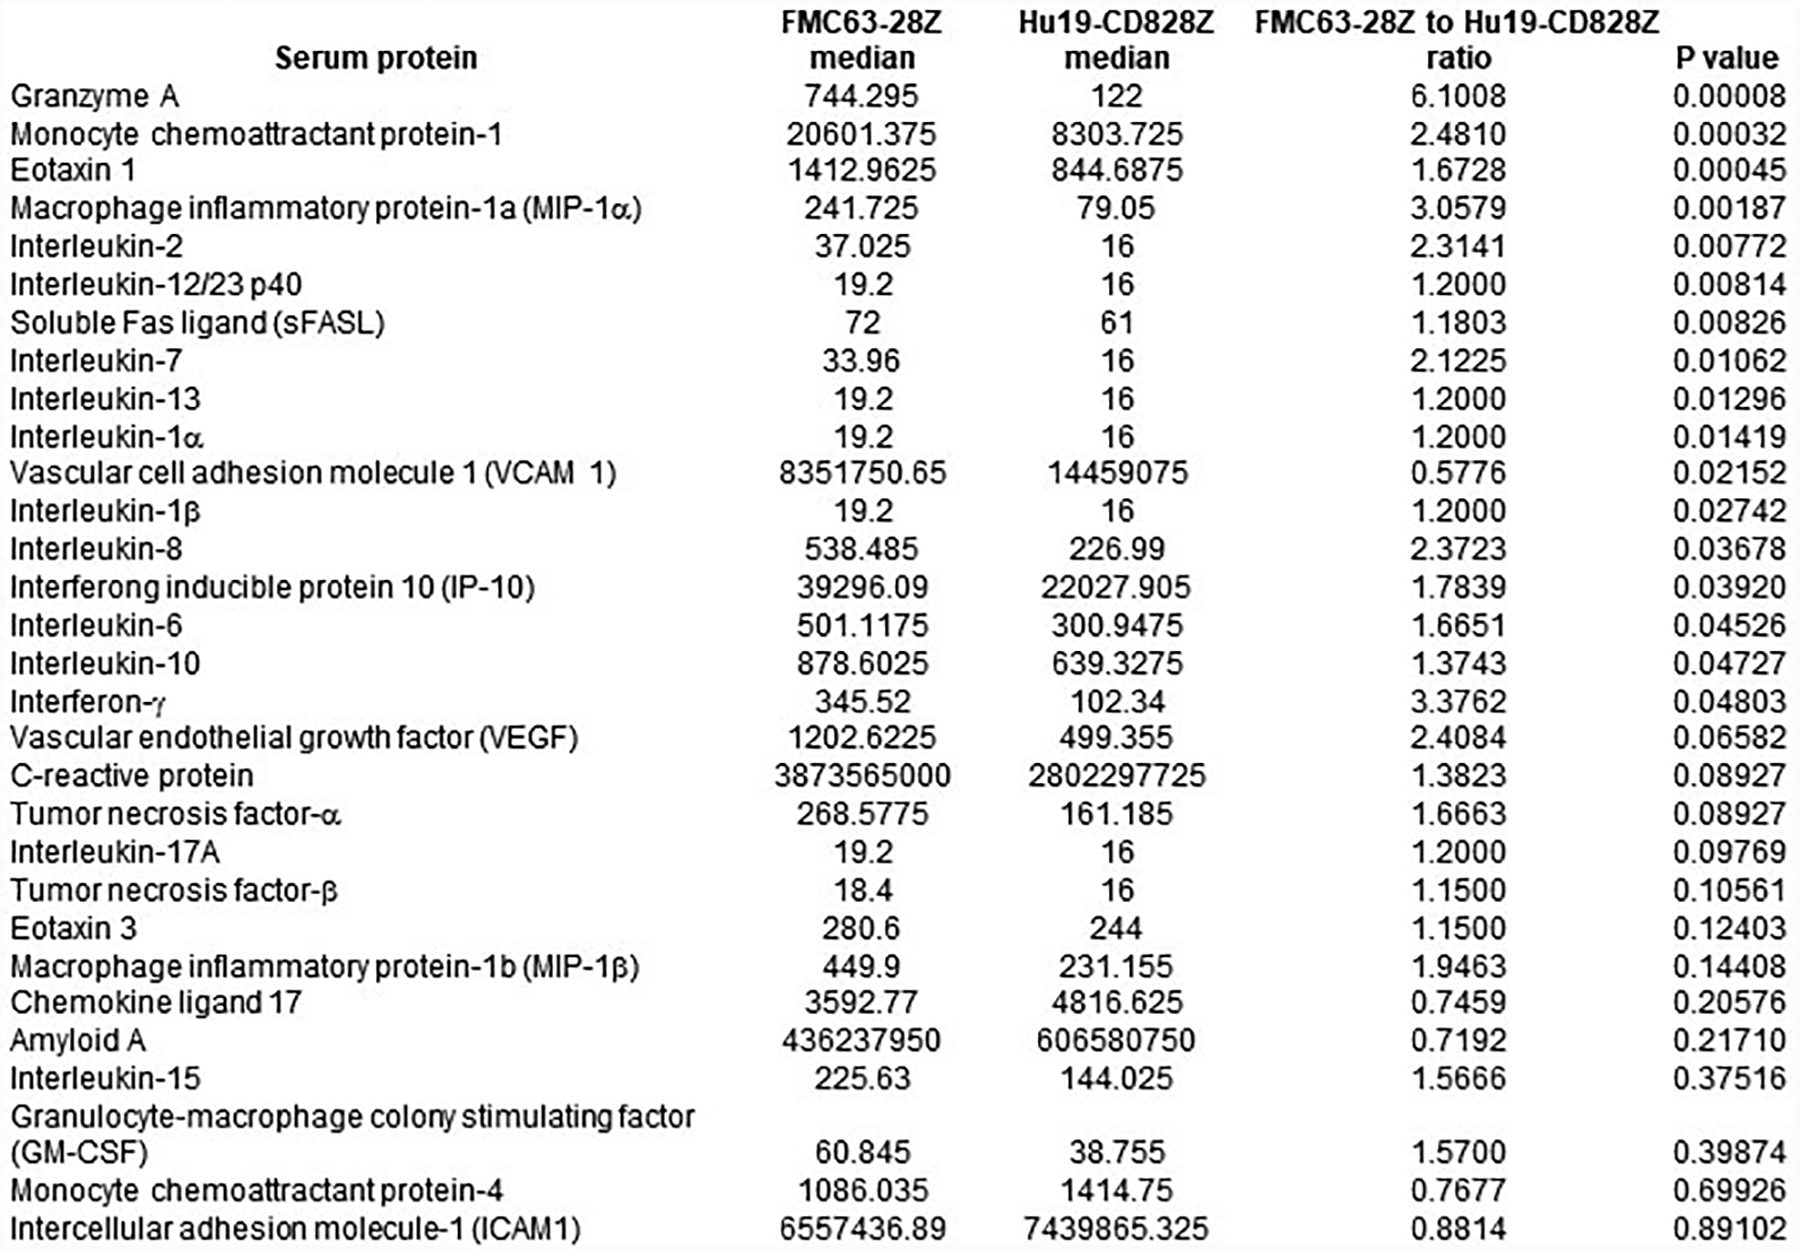
Immunologic proteins areas under the curves. For all proteins, all 22 patients on the trial of FMC63–28Z T cells and all 20 patients on the trial of Hu19-CD828Z T cells were compared. Proteins were measured in serum samples by Luminex® assay from days 2 to 14 after CAR T-cell infusion. Area under the curve (AUC) was calculated by trapezoidal method. Statistics were by 2-tailed Mann-Whitney test.