
Extended Data Fig. 9. Blood CAR T-cell levels and anti-CAR immune responses.
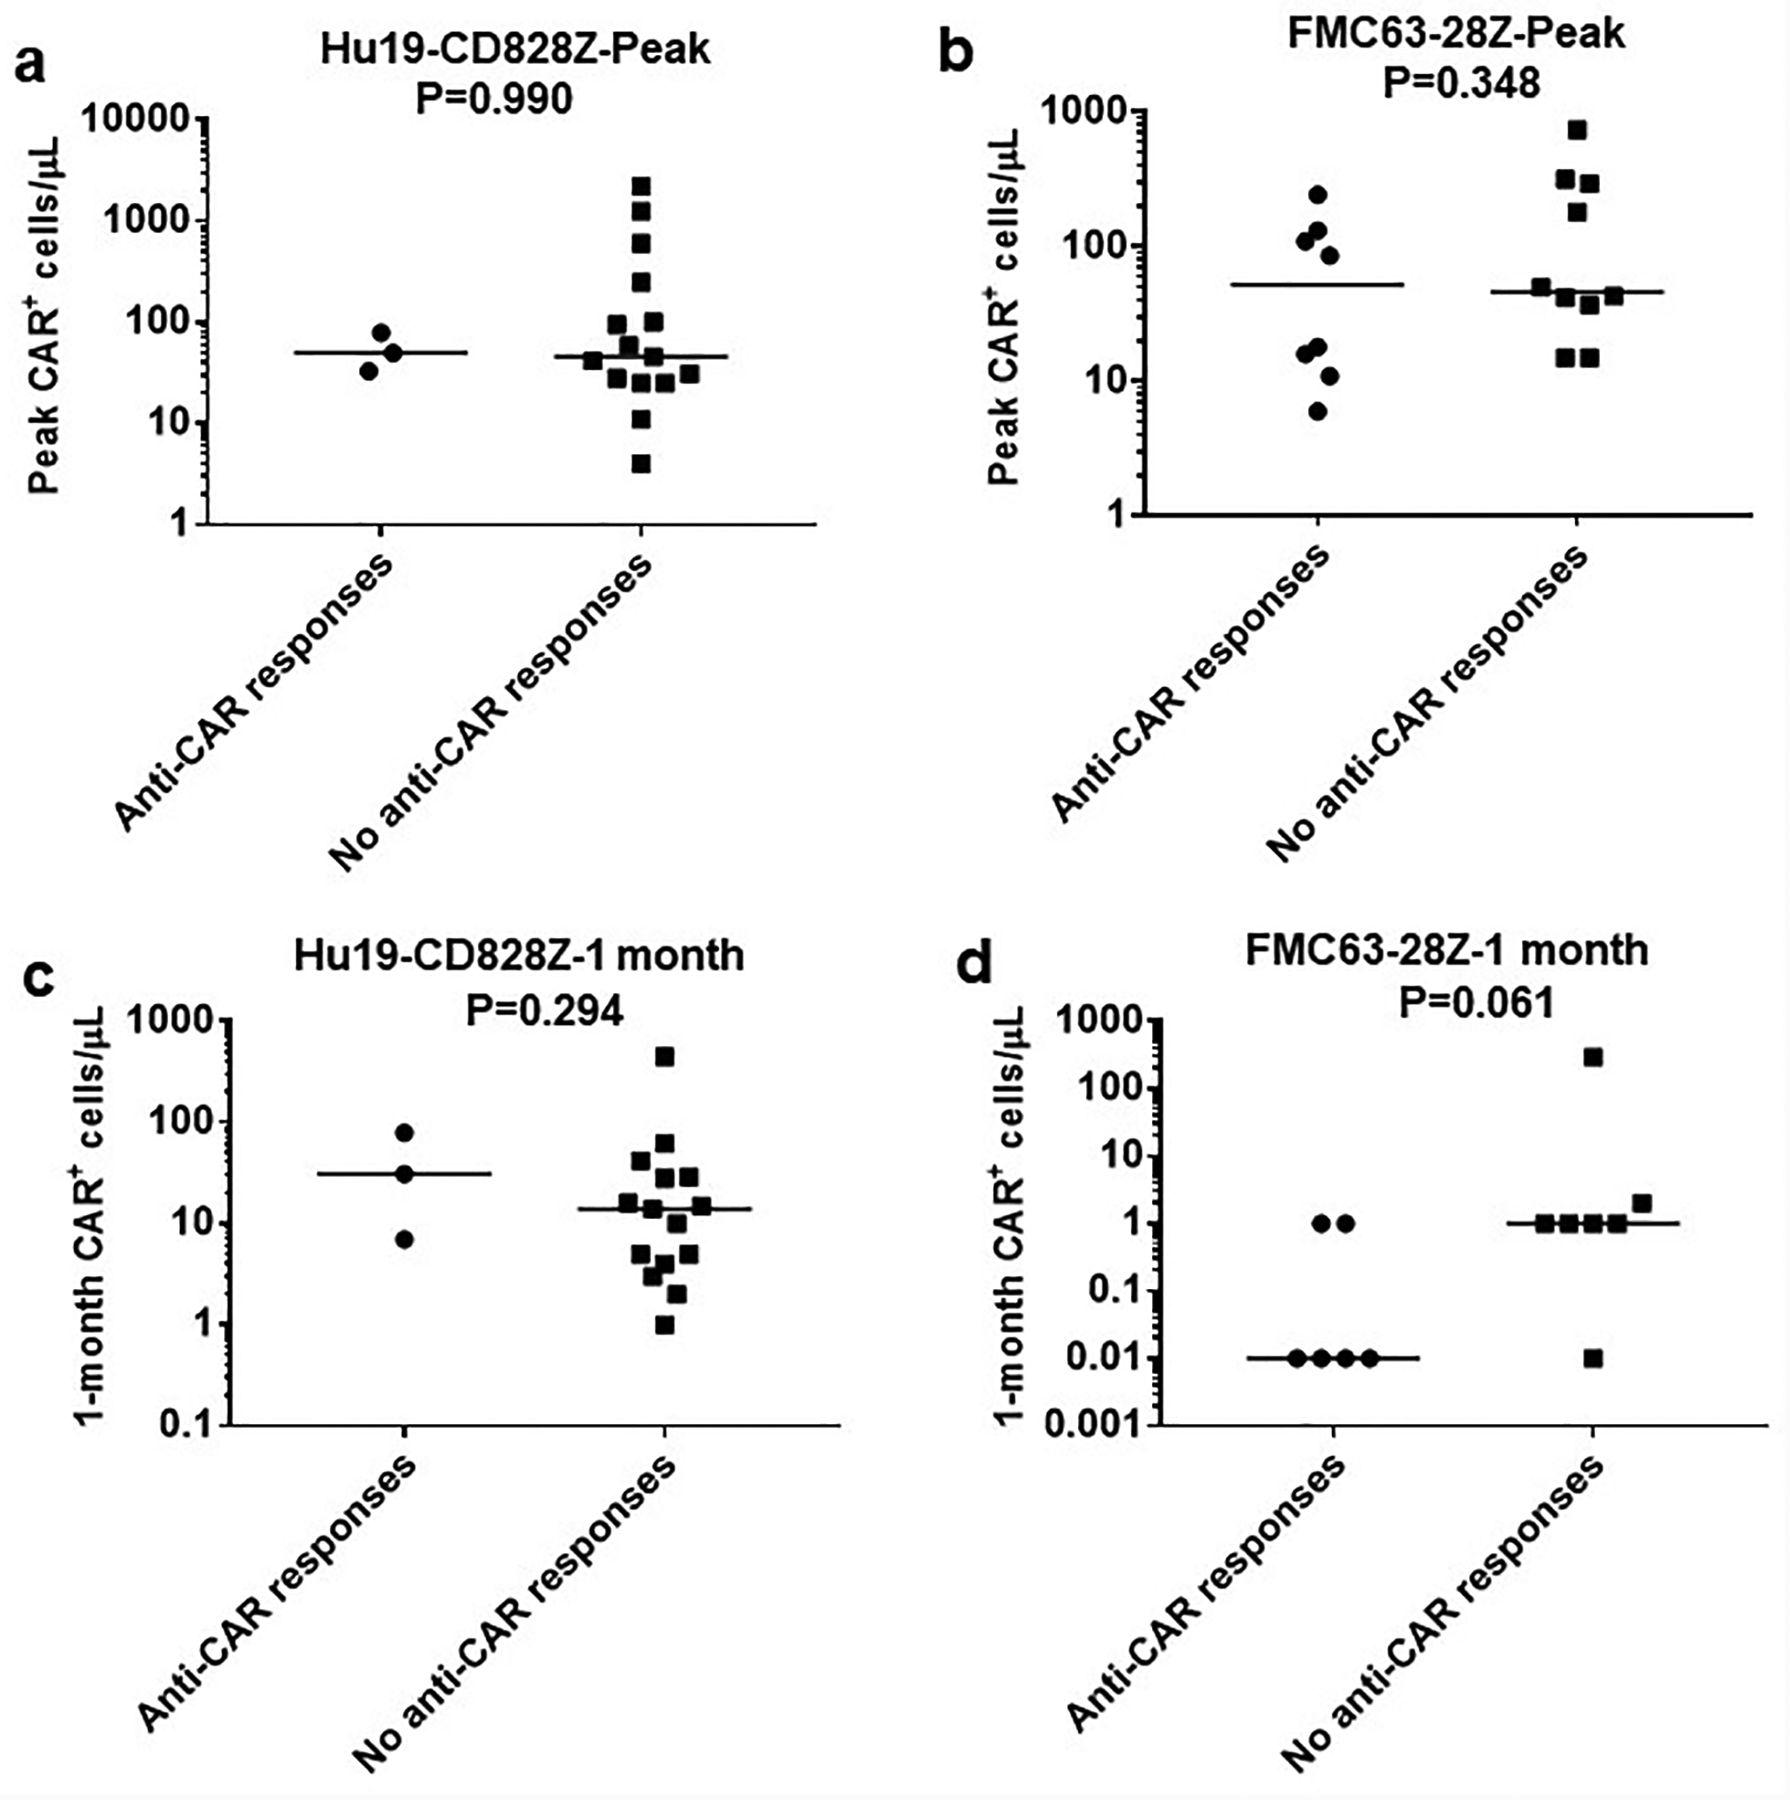
Blood CAR T-cell levels and anti-CAR immune responses. Anti-CAR T-cell responses were assessed by ELISPOT analysis of PBMC before CAR T-cell treatment and at time-points within 6 weeks after CAR T-cell infusion as summarized in Extended Data 8. CAR+ cell levels in the blood were assessed by quantitative PCR. The top row shows peak blood CAR+ cell levels with results divided into patients with or without anti-CAR responses by ELISPOT. (a) Hu19-CD828Z (b) FMC63–28Z. The bottom row shows blood CAR+ cell levels 1-month after CAR T-cell infusion with results divided into patients with or without anti-CAR responses detected by ELISPOT: (c) Hu19-CD828Z, (d) FMC63–28Z. No statistically significant differences in blood CAR+ cell levels were found between patients with or without anti-CAR responses. All patients with adequate cell samples for both ELISPOT and qPCR are included. P values by Mann-Whitney test are shown on the plots; significance was defined as P<0.05. Of the 4 comparisons, the FMC63–28Z 1-month comparison was closest to statistical significance with P=0.061. Each symbol represents an individual patient. The number of unique patients analyzed were as follows: Hu19-CD828Z Peak, n=18; FMC63–28Z Peak, n=18; Hu19-CD828Z 1 month, n=18; FMC63–28Z 1 month n=13.