
Extended Data Fig. 4. Peak serum protein levels.
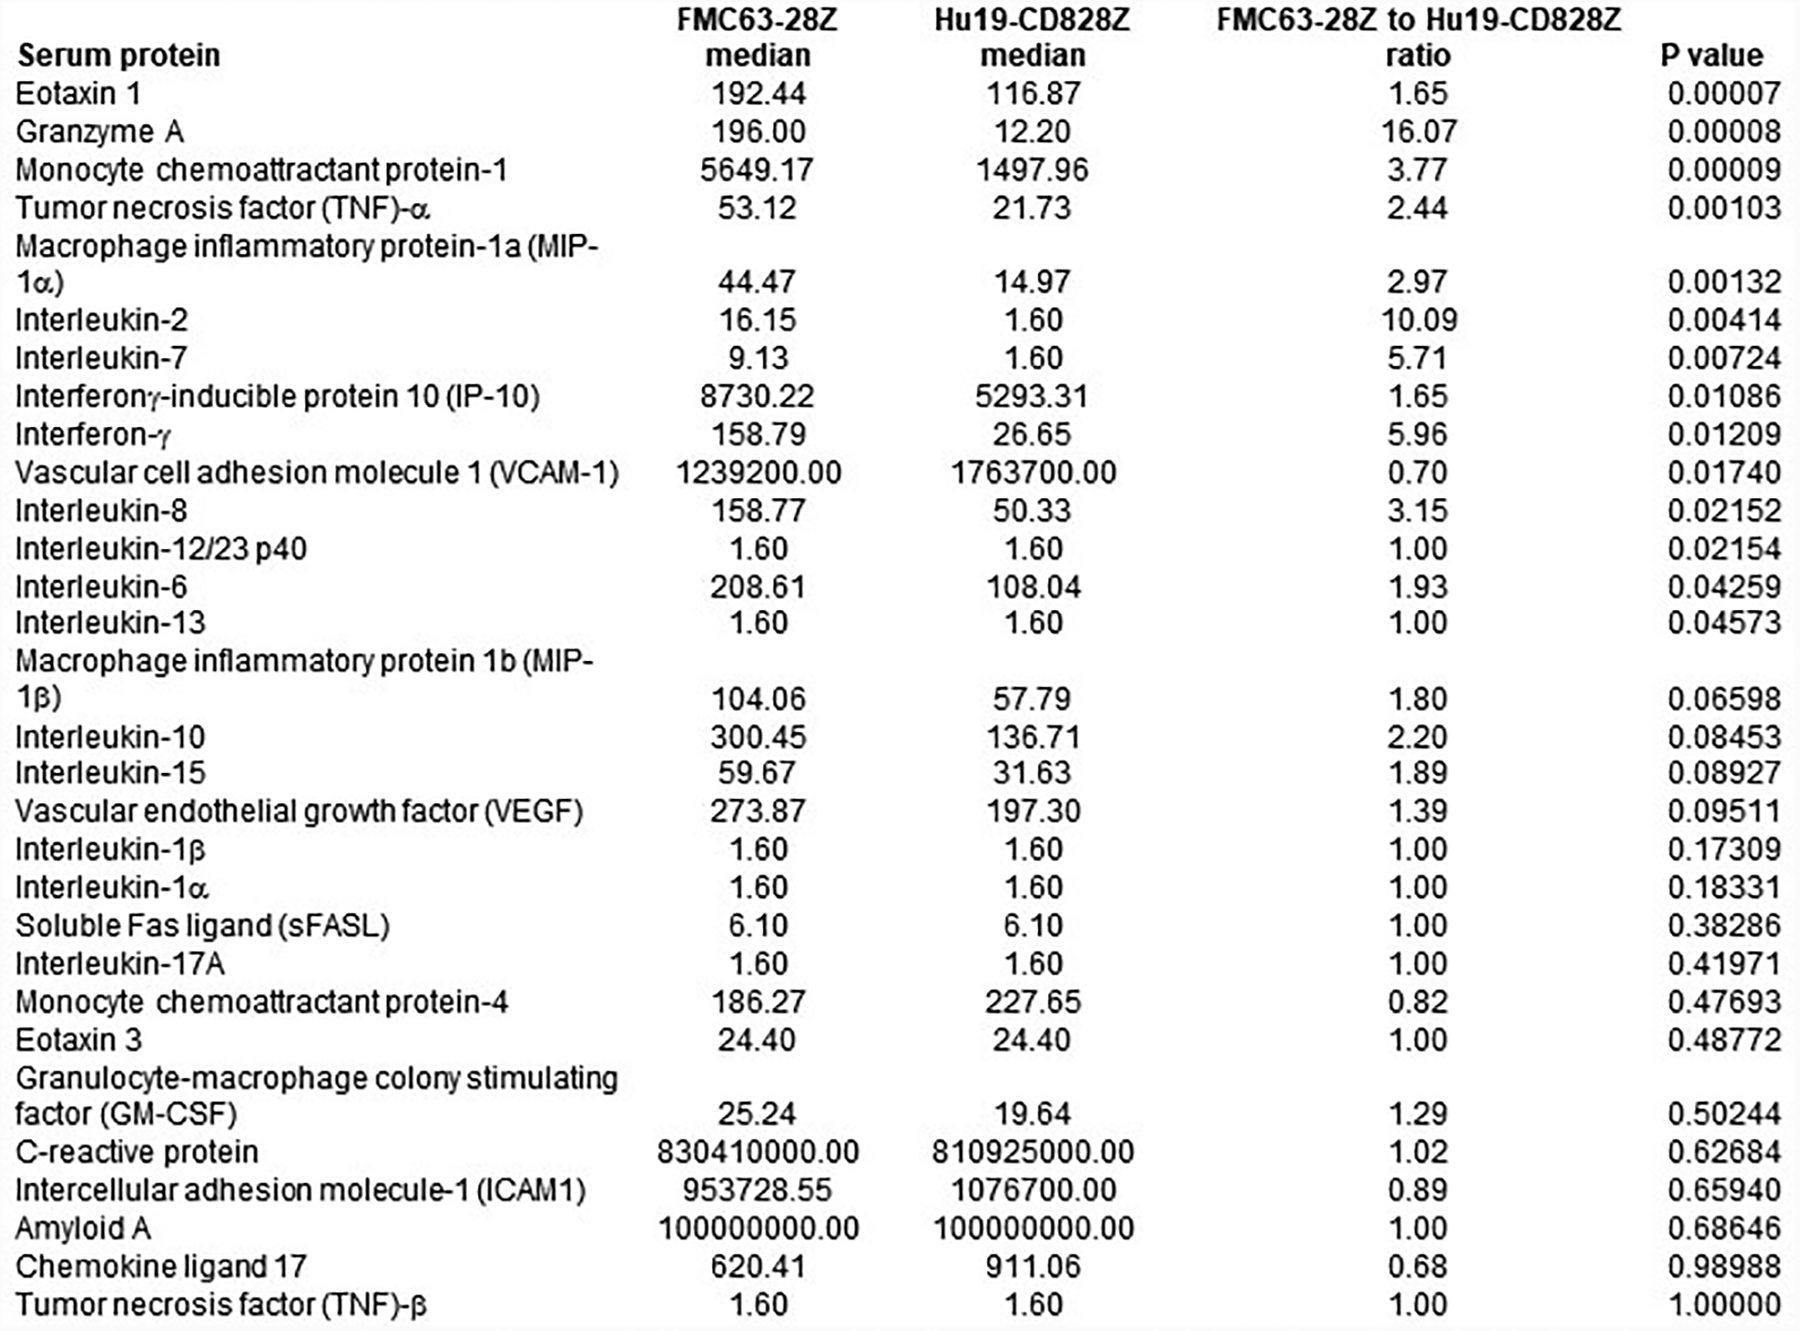
Peak immunologic protein levels. For all proteins, all 22 patients on the trial of FMC63–28Z T cells and all 20 patients on the trial of Hu19-CD828Z T cells were compared. Proteins were measured in serum samples by Luminex® assay between day 2 and 14 after CAR T-cell infusion. Statistics were by 2-tailed Mann-Whitney test.