

Abstract
Objective
To identify the genetic cause for progressive peripheral nerve disease in a Venezuelan family.
Background
Despite the growing list of genes associated with Charcot-Marie-Tooth disease, many patients with axonal forms lack a genetic diagnosis.
Methods
A pedigree was constructed, based on family clinical data. Next-generation sequencing of mitochondrial DNA (mtDNA) was performed for six affected family members. Muscle biopsies from four family members were used for analysis of muscle histology and ultrastructure, mtDNA sequencing, and RNA quantification. Ultrastructural studies were performed on sensory nerve biopsies from two affected family members.
Results
Electrodiagnostic testing showed a motor and sensory axonal polyneuropathy. Pedigree analysis revealed inheritance only through the maternal line, consistent with mitochondrial transmission. Sequencing of mtDNA identified a mutation in the mitochondrial tRNAVal (mt-tRNAVal) gene, m.1661A>G, present at nearly 100% heteroplasmy, which disrupts a Watson-Crick base pair in the T-stem-loop. Muscle biopsies showed chronic denervation/reinnervation changes, while biochemical analysis of electron transport chain (ETC) enzyme activities showed reduction in multiple ETC complexes. Northern blots from skeletal muscle total RNA showed severe reduction in abundance of mt-tRNAVal, and mildly increased mt-tRNAPhe, in subjects compared to unrelated age- and sex-matched controls. Nerve biopsies from two affected family members demonstrated ultrastructural mitochondrial abnormalities (hyperplasia, hypertrophy, crystalline arrays) consistent with a mitochondrial neuropathy.
Conclusion
We identify a previously unreported cause of Charcot-Marie-Tooth (CMT) disease, a mutation in the mt-tRNAVal, in a Venezuelan family. This work expands the list of CMT-associated genes from protein-coding genes to a mitochondrial tRNA gene.
Introduction
Charcot-Marie-Tooth disease (CMT) is a collection of hereditary motor and sensory neuropathies with a progressive, degenerative course that leads to debilitating weakness and sensory loss beginning in childhood or early adulthood (1). Two broad categories of CMT are the demyelinating form, caused by Schwann cell dysfunction, and the axonal form, caused by degeneration of peripheral nerve axons. Although these subtypes are clinically indistinguishable, the demyelinating form manifests with slowed nerve conduction velocities and secondary axon loss, while the axonal form shows reduction of sensory and motor action potential amplitudes with normal or mildly reduced conduction velocities. To date, more than 100 protein-coding genes have been implicated as causative in individual forms of CMT (1), with dominant mutations being far more common than recessive. Demyelinating CMT is most frequently due to duplication of the PMP22 gene, while axonal CMT is more genetically heterogeneous. Some subtypes of CMT affect other organ systems, such as the CNS (2,3,4,5), while multisystem disorders, such as mitochondrial diseases (6,7), lysosomal diseases (8,9), spinocerebellar ataxias (10,11), and hereditary spastic paraparesis (12,13), can include motor and sensory neuropathies.
Here we report a large, mostly indigenous family from the Venezuelan Andes with axonal CMT and a pedigree consistent with a mitochondrial inheritance pattern. Our study includes characterization of affected and unaffected family members by neurological examination and electrodiagnostic studies. Through genetic, biochemical, and histopathologic studies, we demonstrate that this family’s disease is due to a point mutation in mt-tRNAVal. This mutation is homoplasmic in affected family members and an unaffected carrier, suggesting variable penetrance. This is the first report, to our knowledge, of a tRNA mutation causing a CMT phenotype, and is only the second mtDNA gene associated with CMT, the other being mutations in ATP6, which encodes a complex V subunit (14). Mitochondrial dysfunction (15) has been implicated in many subtypes of CMT, most frequently with mutations of mitofusin-2 (16) and GDAP-1 (17), but also in rare mutations of nuclear-encoded mitochondrial proteins such as SURF-1 (18), and several mitochondria-targeted aminoacyl-tRNA synthetases (19). Mutations in mtDNA causing peripheral neuropathy are well-described in complex phenotypes such as MELAS and MERRF (20, 21), but are not typically considered to cause a CMT phenotype, outside of ATP6. This work adds to the growing literature on the diversity of the genetic causes of peripheral neuropathy and extends the spectrum of mitochondrial diseases, which can involve gene mutations in both mtDNA and nuclear DNA (22).
Methods
This research was designed as a field study and was approved by the Ethics Committee of the University of The Andes (Mérida, Venezuela). Written informed consent was obtained from all patients by one of the authors (Y.G.). Clinical evaluations took place at the patients’ homes, whereas the electrophysiological investigations were performed at the University Hospital of The Andes and imaging studies at the Mérida Clinical Hospital.
Family
The family originates from a single village in the Sucre Municipality, Mérida State, Venezuela with predominantly indigenous ancestry. The majority of descendants presently live in towns and villages near the original one. This CMT-affected family consists of eleven branches with subjects 1.1 and 1.2 as common ancestors (Fig 1A). The documented genealogy spans a period of 200 years (8 generations) and 14 pedigree branches (Fig 1B, Supplementary Table 1). More than 3722 members, from the 11 family branches, are still alive. Children of consanguineous marriages were found between branches B and C and between branches E and F (Supplementary Table 1). Ninety-seven patients (55 females and 42 males) were clinically diagnosed with motor and sensory neuropathy. In all the branches, disease was transmitted through maternal lineage, with no instances of male transmission. As for the evaluated patients, the parents were not clinically affected in 10 family units (23 patients), while at least one parent was affected in 14 family units (74 patients).
Fig. 1.

First and Second Generations of the Pedigree (A) and a Representative Branch “D” of the Pedigree (B).
Electrodiagnostics
Standard clinical and electrophysiological examinations [including distal motor latencies (DML), motor nerve conduction velocities (MNCV), and compound muscle action potential (CMAP)] (23) were performed in the median, ulnar, peroneal and tibial nerves. Sensory nerve conduction velocities (SNCV) and sensory nerve action potentials (SNAP) were recorded from the median, ulnar and sural nerves. All the tests were performed at a skin temperature of at least 32oC. Electromyography (EMG) was performed with monopolar needle electrodes in the deltoids, biceps brachii, extensor digitorum, opponens pollicis, tibialis anterior, peroneus longus and gastrocnemius muscles.
DNA Sequencing
DNA was isolated from whole blood. Whole exome sequencing was performed using an Illumina (San Diego, CA, USA) platform, and linkage analysis was performed using a human OMNI 2.5M BeadChip. Next-generation mitochondrial DNA sequencing from blood-derived DNA was performed by GeneDx (Gaithersburg, MD, USA), while mitochondrial DNA sequencing from muscle was performed by Baylor Genetics (Houston, TX, USA). Sequencing of the mtATP6 gene was performed with the following primers: Forward 5’-GGGCCCGTATTTACCCTATAGC-3’ and Reverse 5’-GGGTCATGGGCTGGGTTTTA-3’ complementary to the preceding COX2/mt-tRNALys genes and following COX3 genes, respectively, using Pfusion II Master Mix, according to the manufacturer’s instructions (ThermoFisher Scientific, Waltham, MA, USA).
Histology
Flash-frozen muscle tissue was evaluated using a limited panel of standard muscle stains (hematoxylin and eosin [H&E]; modified Gomori trichrome; nicotinamide adenine dinucleotide tetrazolium reductase (NADH-TR); succinate dehydrogenase (SDH); cytochrome C oxidase (COX), dual immunohistochemistry for slow and fast myosin proteins; and nonspecific esterase). All stains were performed by UCSF Clinical Neuromuscular Pathology Laboratory. Light microscopy images were acquired with a DP72 digital camera on a BX41 bright-field light microscope using cellSens Entry 1.4 software (all by Olympus).
Ultrastructural analysis
Ultrathin (80 nm) sections of the glutaraldehyde-fixed, Epon-embedded muscle or nerve tissue were stained with 2% uranyl acetate, followed by 1.5% lead citrate. Sections were examined in an FEI Tecnai G2–12BT transmission electron microscope at 80 kV, with images obtained with a AMT camera model XR-60. Images of 20–26 pictures were evaluated for each muscle biopsy, and images of 40–42 pictures for each nerve biopsy.
Electron Transport Chain Analyses
Activities of complexes I, II, III, IV and citrate synthase from frozen muscle tissue were measured by Baylor Genetics (Houston, TX, USA) and immunohistochemistry of electron transport chain proteins was analyzed by the Molecular Neuropathology Laboratory, Texas Children’s Hospital (Houston, TX, USA).
Northern Blot
Archival frozen muscle tissue from age- and sex-matched unrelated individuals was obtained from UCSF Pathology Department. The control subjects had no clinical history suggestive of a metabolic disorder and their muscle biopsies showed no pathologic abnormalities. Total RNA was isolated from muscle using a tissue homogenizer and the miRNeasy Mini Kit (Qiagen, Germantown, MD, USA). Each total RNA sample (1.5 μg) was heated at 85 ⁰C for 3 min, mixed with 5 μL of the denaturing loading solution (7 M urea, 0.25% xylene cyanol, and 0.25% bromophenol blue), and loaded onto a 12% polyacrylamide/7 M urea gel on a mini Bio-Rad apparatus in 1X Tris-borate (pH 8.0) EDTA (TBE) buffer. After electrophoresis for 30 min at 200V (room temperature), the gel was electroblotted onto a positively charged Hybond nylon membrane (GE Healthcare) using the Bio-Rad tank system at 400 mA for 1 h. The electroblotted membrane was briefly air dried, and RNA on the membrane was crosslinked to the membrane in a UV crosslinker (FB-UVXL-1000, Fisher Scientific, in the optimal crosslink mode). The membrane was then pre-incubated in hybridization buffer (0.9 M NaCl, 90 mM Tris-HCl (pH 7.5), 6 mM EDTA, 0.3% SDS, 1% dry milk) at 37 ⁰C for 1–2 h and probed with a set of three DNA oligonucleotide probes, each 32P-labeled at the 5’ end. The set for monitoring mt-tRNAVal contained a DNA probe targeting positions 29 to 46 of human mt-tRNAVal (5’-TCTCCTAAGTGTAAGTTG-3’), while the set for monitoring mt-tRNAPhe contained a DNA probe targeting positions 42 to 62 of human mt-tRNAPhe (5’-TGATGTGAGCCCGTCTAA-3’). Both sets also contained a second DNA probe targeting positions 39 to 56 of human mt-tRNALeu(UUR) (5’-GAACCTCTGACTGTAAAG-3’) and the third probe targeting the 3’-end region of the nuclear-encoded 5S rRNA (5’-GGGTGGTATGGCCGTAGAC-3’). The three probes (each at 106 cpm) of each set were incubated with the membrane in hybridization buffer for 12 h while shaking. The probes were washed with 2X SSC buffer (0.3 M NaCl, 30 mM Na-Citrate) at 37 ⁰C two times for 10–15 min. with gentle shaking. The membrane was then dried and imaged (Amersham Typhoon model 9500, GE), using ImageJ software (NIH).
Results
Pedigree
The large pedigree for this family is divided into branches A through K (Fig. 1A), with affected individuals present in every generation where family members are still living. There is no transmission of the disease phenotype through males, and notably all descendants of affected males in the second generation (G2.1, H2.2, I2.1, J2.1) are unaffected. A representative pedigree branch (D) illustrates the lack of male transmission (Figure 1B). The remainder of the pedigree is included in Supplementary Table 1. Age of onset is similar in both genders, 12.7 years in females (range 1–39 years, median 11.0) and 11.4 in males (range 1–40, median 10.5). A single outlier was removed from each gender group for calculations (female with onset at age 68 years and a male with onset at 55 years, due to a greater risk of phenocopies with older age). Taken together, these findings argue against an X-linked mode of transmission, and are most consistent with a mitochondrial inheritance pattern.
Clinical Data
One hundred family members with neurological symptoms were evaluated. Clinical findings suggested that 97 suffered from CMT-associated symptoms, while three had other neurological diagnoses (B 5.41, B 5.58 and B 5.72) and one an orthopedic disorder (D 6.71). Detailed clinical evaluations were performed on 44 of the 97 CMT-affected patients (Table 1, Supplementary Table 2). Their ages ranged from 9 to 80 years (mean ± SD; 41.1 ± 18.0), and disease duration ranged between 2 and 60 years (25.8 ± 14.6). The age of onset of clinical symptoms was between 1 and 68 years (15.3 ± 15.2). The majority of patients presented with symmetric, mild-to-severe weakness of the distal lower extremities, and atrophy of foot and calf muscles was observed in 29 patients. Thirty-one patients were still able to walk without aid, whereas the remaining ones were ambulatory with a cane (6) or walker (2), or required the use of a wheelchair (5). Ten patients had weakness of the distal upper limbs, most prominently affecting finger extension and wrist flexion. Seven of these 10 patients were over 52 years old, and all showed atrophy of the thenar, hypothenar and the interosseous muscles. Tendon reflexes showed great intra-familial variability, with hyperreflexia in some individuals and hyporeflexia or areflexia in others; Babinski reflex was present in 28 patients. In the lower limbs, 26 patients showed a deficit in vibration sensation and 23 showed a deficit in proprioception, whereas no patient showed a deficit in touch or pain sensation. Sensory ataxia was observed in all affected patients except E 6.70 and EF1 4.5. Pes cavus foot deformity was observed in 37 patients, equinovarus foot deformity in five, and claw toes in 8 individuals. Three patients (BC 4.2, D 5.111, D 5.136) had scoliosis. Spastic paraparesis was observed in patients C 3.6, D 4.8, D 5.109, EF1 4.3 and EF1 4.5, with Patient D 5.109 having a neurogenic bladder. Patients C 3.6 and BC 5.8 had vocal cord paresis. Brain MRI was performed in three patients (B 5.93, BC 5.8 and D 6.178), and was normal for each of them. Of the three patients with alternative diagnoses (B 5.41, B 5.58, and B 5.72), B 5.41 and B 5.58 had cerebral palsy, while patient B 5.72 had a congenital myelopathy.
Table 1.
Clinical Features
| Patient | Age of onset/Gender | Disease Duration (years) | UE Strength I/D | LE Strength P/I/D | Reflexes | Sensory Loss UE/LE | Distal Atrophy UE/LE | Deformities | Mobility |
|---|---|---|---|---|---|---|---|---|---|
| A 4.2 | 44/F | 39 | 5/5 | 5/5/5 | 2/2/2 | No | None | Pc | Ambulatory |
| A 5.1 | 15/M | 12 | 5/5 | 5/4/5 | 2/2/2 | No | None | Pc + claw | Ambulatory |
| A 5.2 | 18/F | 16 | 5/5 | 5/4/5 | 2/2/2 | No | None | Pc | Ambulatory |
| A 5.5 | 22/F | 8 | 5/5 | 5/5/5 | 2/2/2 | No | No/Yes | Pc | Ambulatory |
| B 5.88 | 37/M | 23 | 5/5 | 5/4/3 | 2/3/2 | No/Yes | No/Yes | Pc + claw | Ambulatory |
| B 5.93 | 40/F | 38 | 5/5 | 5/4/3 | 3/3/2 | No/Yes | No/Yes | Pc + claw | Ambulatory |
| B 6.28 | 19/F | 17 | 5/5 | 5/4/4 | 2/2/2 | No/Yes | No/Yes | Pc | Ambulatory |
| B 6.29 | 22/M | 20 | 5/5 | 5/4/3 | 3/3/0 | No | No/Yes | Pc | Ambulatory |
| BC 4.2 | 59/F | 33 | 5/4 | 5/4/3 | 2/1/0 | No | Yes/Yes | Pc | Cane |
| BC 5.1 | 26/M | 24 | 5/5 | 4/4/4 | 3/3/2 | No | Yes/Yes | Pc + claw | Ambulatory |
| BC 5.5 | 30/F | 15 | 5/5 | 4/4/4 | 3/2/0 | No/Yes | None | Pc | Ambulatory |
| BC 5.8 | 32/M | 31 | 5/4 | 4/3/3 | 3/0/0 | Yes/Yes | Yes/Yes | Pc + claw | Wheelchair |
| C 3.6 | 80/M | 60 | 3/3 | 3/1/0 | 2/0/0 | Yes/Yes | Yes/Yes | None | Wheelchair |
| C 5.68 | 38/F | 28 | 5/5 | 5/4/4 | 2/2/0 | No/Yes | None | Pc | Ambulatory |
| C 5.79 | 36/M | 26 | 5/5 | 5/4/3 | 2/1/0 | No/Yes | No/Yes | Pc | Ambulatory |
| C 5.87 | 44/M | 34 | 5/5 | 5/4/3 | 3/3/0 | No/Yes | No/Yes | Pc | Ambulatory |
| D 4.8 | 61/F | 43 | 4/4 | 3/2/2 | 3/0/0 | Yes/Yes | Yes/Yes | Pc + varus | Wheelchair |
| D 4.28 | 69/F | 51 | 5/5 | 4/3/1 | 2/0/0 | No/Yes | Yes/Yes | Pc + varus | Walker |
| D 5.97 | 32/M | 21 | 5/5 | 5/4/3 | 2/2/0 | No/Yes | No/Yes | Pc | Ambulatory |
| D 5.100 | 35/F | 20 | 5/5 | 5/4/4 | 2/2/0 | No/Yes | None | Pc + claw | Ambulatory |
| E 4.39 | 75/M | 20 | 5/5 | 5/4/4 | 1/2/1 | No | No/Yes | None | Cane |
| E 5.93 | 47/F | 5 | 5/5 | 5/5/4 | 2/2/1 | No/Yes | None | Pc | Ambulatory |
| E 6.70 | 9/F | 5 | 5/5 | 5/5/4 | 2/2/1 | No/Yes | No/Yes | Pc | Ambulatory |
| EF1 4.3 | 52 F | 50 | 5/5 | 5/3/2 | 0/0/0 | Yes/Yes | Yes/Yes | Pc + varus | Cane |
| EF1 4.5 | 57/F | 47 | 5/5 | 4/3/3 | 3/3/0 | No | No/Yes | Pc + varus | Cane |
| EF1 4.12 | 70/M | 30 | 5/5 | 5/4/3 | 2/1/0 | No/Yes | No/Yes | None | Cane |
| EF1 4.14 | 72/M | 44 | 4/4 | 3/2/1 | 0/0/0 | Yes/Yes | Yes/Yes | Pc | Wheelchair |
| F 5.243 | 70/F | 2 | 5/5 | 5/5/5 | 2/2/2 | No/Yes | No/No | Pc | Ambulatory |
| F 6.357 | 30/M | 22 | 5/5 | 5/4/4 | 3/4/4 | No/Yes | No/Yes | None | Ambulatory |
| F 6.363 | 35/M | 18 | 5/4 | 5/4/4 | 2/2/1 | No/Yes | None | Pc | Ambulatory |
UE, upper extremity; LE, lower extremity; P, proximal (knee extensor or flexor); I, intermediate (hand extensor or flexor (UE); foot extensor or flexor (LE); D, distal [intrinsic hand muscles (UE), intrinsic foot muscles (LE)]. Motor scale: 5, normal; 4, mild weakness; 3, ability to lift against gravity; 2, not able to lift against gravity, but movement visible; 1, no movement but tendon contraction visible; 0, complete paralysis. Reflexes: 4, clonus; 3 increased; 2, normal; 1, reduced; 0, absent; Deformities: Pc- pes cavus, claw- claw toes.
Electrodiagnostics
Electrophysiological studies were performed in 22 patients with gait difficulties (Table 2, Supplementary Table 3). Four subjects (B 5.41, B 5.58, B 5.72 and D 6.71) exhibited normal results, while the remaining 18 patients confirm the clinical diagnosis of a length-dependent, motor and sensory, axonal polyneuropathy, as evidenced by reduced or absent compound motor action potential amplitudes in the lower more than upper extremities, with a less prominent demyelinating component. Conduction velocities were in the normal or intermediate demyelinating range (no conduction velocities slower than 27 m/s were observed), while distal motor latencies were normal or mildly prolonged. Sensory nerves were more severely affected than motor nerves. Electromyography (data not shown) revealed increased insertional activity, polyphasic motor unit potentials and a pattern of reduced recruitment, particularly in the lower limbs.
Table 2.
Electrophysiological Data.
| Patient | Nerve | Motor NCS | Sensory NCS | ||||||||
|---|---|---|---|---|---|---|---|---|---|---|---|
| DML (ms) | MNCV (m/s) | CMAP Amp. (mV) | SNCV (m/s) | SNAP Amp. (μV) | |||||||
| Right | Left | Right | Left | Right | Left | Right | Left | Right | Left | ||
| B 5.88 | Median | 5.6 | 5.0 (≤ 4.4) | 41.0 | 47.0 (≥ 49) | 2.1 | 1.6 (≥ 4.0) | NR | NR | NR | NR |
| Ulnar | 3.6 | 3.8 (≤ 3.3) | 42.0 | 44.0 (≥ 49) | 4.3 | 4.3 (≥ 6.0) | NR | NR | NR | NR | |
| Tibial | 5.8 | 6.2 (≤ 5.8) | 34.0 | 27.0 (≥ 41) | 0.4 | 1.0 (≥ 4.0) | |||||
| Peroneal | 5.5 | 7.3 (≤ 6.5) | 27.0 | 40.0 (≥ 44) | 1.4 | 1.3 (≥ 2.0) | |||||
| B 5.93 | Median | 5.2 | 4.8 (≤ 4.4) | 50.0 | 51.0 (≥ 49) | 4.8 | 4.7 (≥ 4.0) | NR | NR | NR | NR |
| Ulnar | 3.4 | 3.7 (≤ 3.3) | 50.0 | 50.0 (≥ 49) | 4.4 | 7.3 (≥ 6.0) | NR | NR | NR | NR | |
| Tibial | 4.6 | 5.6 (≤ 5.8) | 38.0 | 41.0 (≥ 41) | 0.6 | 0.4 (≥ 4.0) | |||||
| Peroneal | 4.6 | 4.8 (≤ 6.5) | 35.0 | 40.0 (≥ 44) | 1.8 | 0.4 (≥ 2.0) | |||||
| B 6.28 | Median | 3.9 | 3.7 (≤ 4.4) | 54.4 | 52.6 (≥ 49) | 4.9 | 4.2 (≥ 4.0) | NR | NR | NR | NR |
| Ulnar | 3.4 | 3.9 (≤ 3.3) | 59.9 | 67.4 (≥ 49) | 9.6 | 7.6 (≥ 6.0) | NR | NR | NR | NR | |
| Tibial | 6.4 | 5.7 (≤ 5.8) | 46.9 | 44.4 (≥ 41) | 1.3 | 1.4 (≥ 4.0) | |||||
| Peroneal | 5.2 | 5.2 (≤ 6.5) | 47.4 | 55.9 (≥ 44) | 1.8 | 2.5 (≥ 2.0) | |||||
| BC 5.1 | Median | 4.1 | 4.1 (≤ 4.4) | 56.0 | 53.0 (≥ 49) | 3.8 | 3.7 (≥ 4.0) | 48.0 | 44.0 (≥ 50) | 2.8 | 2.3 (≥ 20) |
| Ulnar | 2.7 | 2.6 (≤ 3.3) | 57.0 | 58.0 (≥ 49) | 7.4 | 9.3 (≥ 6.0) | 47.0 | 47.0 (≥ 50) | 2.9 | 3.6 (≥ 17) | |
| Tibial | 4.5 | 6.6 (≤ 5.8) | 28.0 | 38.0 (≥ 41) | 0.4 | 1.0 (≥ 4.0) | |||||
| Peroneal | 3.7 | 4.2 (≤ 6.5) | 48.0 | 54.0 (≥ 44) | 0.5 | 1.8 (≥ 2.0) | |||||
| Sural | 38.0 | 35.0 (≥ 40) | 3.0 | 7.0 (≥ 5 ) | |||||||
| BC 5.5 | Median | 4.8 | 4.2 (≤ 4.4) | 49.0 | 48.0 (≥ 49) | 1.6 | 1.5 (≥ 4.0) | NR | NR | NR | NR |
| Ulnar | 3.0 | 3.0 (≤ 3.3) | 45.0 | 45.0 (≥ 49) | 4.8 | 5.6 (≥ 6.0) | 37.0 | 39.0 (≥ 50) | 1.9 | 3.9 (≥ 17) | |
| Tibial | 9.1 | 9.2 (≤ 5.8) | 20.0 | 30.0 (≥ 41) | 1.0 | 1.0 (≥ 4.0) | |||||
| Peroneal | 5.5 | 6.0 (≤ 6.5) | 40.0 | 31.0 (≥ 44) | 0.6 | 1.6 (≥ 2.0) | |||||
| C 5.68 | Median | 3.9 | 3.9 (≤ 4.4) | 50.0 | 50.0 (≥ 49) | 5.2 | 5.5 (≥ 4.0) | NR | NR | NR | NR |
| Ulnar | 3.5 | 3.3 (≤ 3.3) | 55.0 | 54.0 (≥ 49) | 6.4 | 7.0 (≥ 6.0) | NR | NR | NR | NR | |
| Tibial | 7.2 | 7.2 (≤ 5.8) | 28.0 | 32.0 (≥ 41) | 1.0 | 1.0 (≥ 4.0) | |||||
| Peroneal | 5.8 | 7.6 (≤ 6.5) | 36.0 | 36.0 (≥ 44) | 1.4 | 1.1 (≥ 2.0) | |||||
| C 5.87 | Median | 4.1 | 4.3 (≤ 4.4) | 53.0 | 51.0 (≥ 49) | 6.0 | 4.0 (≥ 4.0) | NR | NR | NR | NR |
| Ulnar | 2.7 | 2.7 (≤ 3.3) | 59.0 | 61.0 (≥ 49) | 6.7 | 6.8 (≥ 6.0) | NR | NR | NR | NR | |
| Tibial | 4.2 | 4.1 (≤ 5.8) | 47.0 | 36.0 (≥ 41) | 2.0 | 2.8 (≥ 4.0) | |||||
| Peroneal | 4.7 | 4.4 (≤ 6.5) | 50.0 | 48.0 (≥ 44) | 5.0 | 2.1 (≥ 2.0) | |||||
| D 5.67 | Median | 4.2 | 4.4 (≤ 4.4) | 50.0 | 49.0 (≥ 49) | 7.0 | 7.5 (≥ 4.0) | 26.4 | 30.4 (≥ 50) | 5.0 | 4.3 (≥ 20) |
| Ulnar | 2.3 | 2.9 (≤ 3.3) | 60.0 | 59.0 (≥ 49) | 7.2 | 7.0 (≥ 6.0) | 40.0 | 40.0 (≥ 50) | 5.3 | 3.6 (≥ 17) | |
| Tibial | 5.2 | 4.6 (≤ 5.8) | 50.0 | 46.0 (≥ 41) | 4.2 | 5.0 (≥ 4.0) | |||||
| Peroneal | 3.7 | 3.9 (≤ 6.5) | 48.0 | 48.0 (≥ 44) | 3.7 | 4.0 (≥ 2.0) | |||||
| D 5.97 | Median | 4.5 | 5.0 (≤ 4.4) | 45.0 | 45.0 (≥ 49) | 4.5 | 5.3 (≥ 4.0) | NR | NR | NR | NR |
| Ulnar | 3.5 | 4.5 (≤ 3.3) | 40.0 | 44.0 (≥ 49) | 5.5 | 5.4 (≥ 6.0) | NR | NR | NR | NR | |
| Tibial | 5.2 | 9.6 (≤ 5.8) | 33.0 | 29.0 (≥ 41) | 1.3 | 0.6 (≥ 4.0) | |||||
| Peroneal | 5.2 | 5.6 (≤ 6.5) | 42.0 | 40.0 (≥ 44) | 1.5 | 0.2 (≥ 2.0) | |||||
| D 5.111 | Median | 5.1 | 4.7 (≤ 4.4) | 44.5 | 53.4 (≥ 49) | 7.4 | 5.8 (≥ 4.0) | NR | NR | NR | NR |
| Ulnar | 3.0 | 3.7 (≤ 3.3) | 67.4 | 58.1 (≥ 49) | 8.2 | 7.7 (≥ 6.0) | NR | NR | NR | NR | |
| Tibial | 4.2 | 5.7 (≤ 5.8) | 33.5 | 41.5 (≥ 41) | 2.5 | 3.7 (≥ 4.0) | |||||
| Peroneal | 6.0 | 4.2 (≤ 6.5) | 37.4 | 45.0 (≥ 44) | 6.5 | 3.2 (≥ 2.0) | |||||
NCS, nerve conduction study; DML, distal motor latency; MNCV, motor nerve conduction velocity; CMAP, compound motor action potential; Amp., amplitude; SNCV, sensory nerve conduction velocity; SNAP, sensory nerve action potential; NR, not recordable. Sural sensory studies are all NR, except as noted for BC 5.1. Normal adult values in parentheses.
Genetic Analysis
Next-generation sequencing of mtDNA isolated from whole blood of one affected family member (D5.131) and one unaffected carrier (B4.30) revealed a homoplasmic variant at position 1661 with an A>G base change, corresponding to a position in the T-stem-loop in the mt-tRNAVal gene. This position is not highly conserved, though it shows comparable conservation to other disease-associated loci in the mt-tRNAVal gene. One likely benign variant, 8875T>C (F117L), was identified in the MT-ATP6 gene, which encodes a subunit of the complex V/ATP synthase and in which other point mutations are reported to cause an axonal CMT phenotype, with or without CNS signs (14). Another likely benign variant, 4123A>G (I273V), was identified in the complex I subunit ND1.
Since mtDNA mutations may be present at different percentage of heteroplasmy across tissues, we obtained muscle tissue from four family members, three affected (D 6.146, B 6.28, D 6.178) and one asymptomatic carrier (D 5.67) whose nerve conduction study showed sensory neuropathy (Table 3). The same homoplasmic variant in mt-tRNAVal at position 1661A>G was identified in all four of these individuals. The same, likely benign, variants were identified in MT-ATP6 (8875T>C) and ND1 (4123A>G), and no other pathogenic variants or variants of unknown significance were identified. However, low frequency of multiple large mtDNA deletions was identified in all three affected individuals, but not in the asymptomatic individual (Table 3).
Table 3.
Summary of Genetic Findings from Muscle Biopsies of Four Family Members
| Subject Pedigree # (Disease Severity) | tRNA-Val 1661 A>G, % Heteroplasmy | Multiple mtDNA Deletions |
|---|---|---|
| B 6.28 (Moderate) | 99.8 | Present |
| D 6.178 (Moderate-Severe) | 99.8 | Present |
| D 6.146 (Mild) | 99.8 | Present |
| D 5.67 (Asymptomatic) | 99.8 | Absent |
Given the large pedigree and apparent presence of unaffected carriers, we also performed additional genetic studies, including linkage analysis and whole exome sequencing. Linkage was performed after obtaining data from microarrays (Illumina, San Diego, CA, USA) for 2.5 million single nucleotide polymorphisms (SNPs) from 13 family members. Analysis of these data with both autosomal dominant and recessive models did not reveal any linkage locus. We also performed whole exome sequencing on four family members, three affected (B 6.28, D 6.178, EF1 5.46) and one clinically unaffected carrier (D 5.67), and found no variants in known CMT-associated genes that segregate with the phenotype. We did consider several rare or novel SNPs that appeared to segregate with disease in these four family members, but on sequencing of these genes in other affected and unaffected family members, there was no clear segregation with the CMT phenotype.
Histopathologic analysis
Muscle biopsy specimens from each of the four family members, including the clinically unaffected carrier, showed findings consistent with both denervation (randomly distributed atrophic fibers with increased esterase activity) and reinnervation (fiber type grouping and hybrid fibers that co-express both myosin proteins); grouped atrophy was not detected, consistent with a slow course of disease progression. Fiber type grouping, a feature of long standing reinnervation, was more pronounced in the muscle of the more severely affected individuals than in the mildly affected individuals (Figures 2A and 2B). Gomori trichrome staining revealed no ragged red fibers in any of the specimens, nor were there any COX-negative fibers. SDH, NADH-TR, and COX stains all showed coarsened internal architecture in the affected individuals, suggestive of mitochondrial enlargement or proliferation (Figures 2C and 2D).
Figure 2.
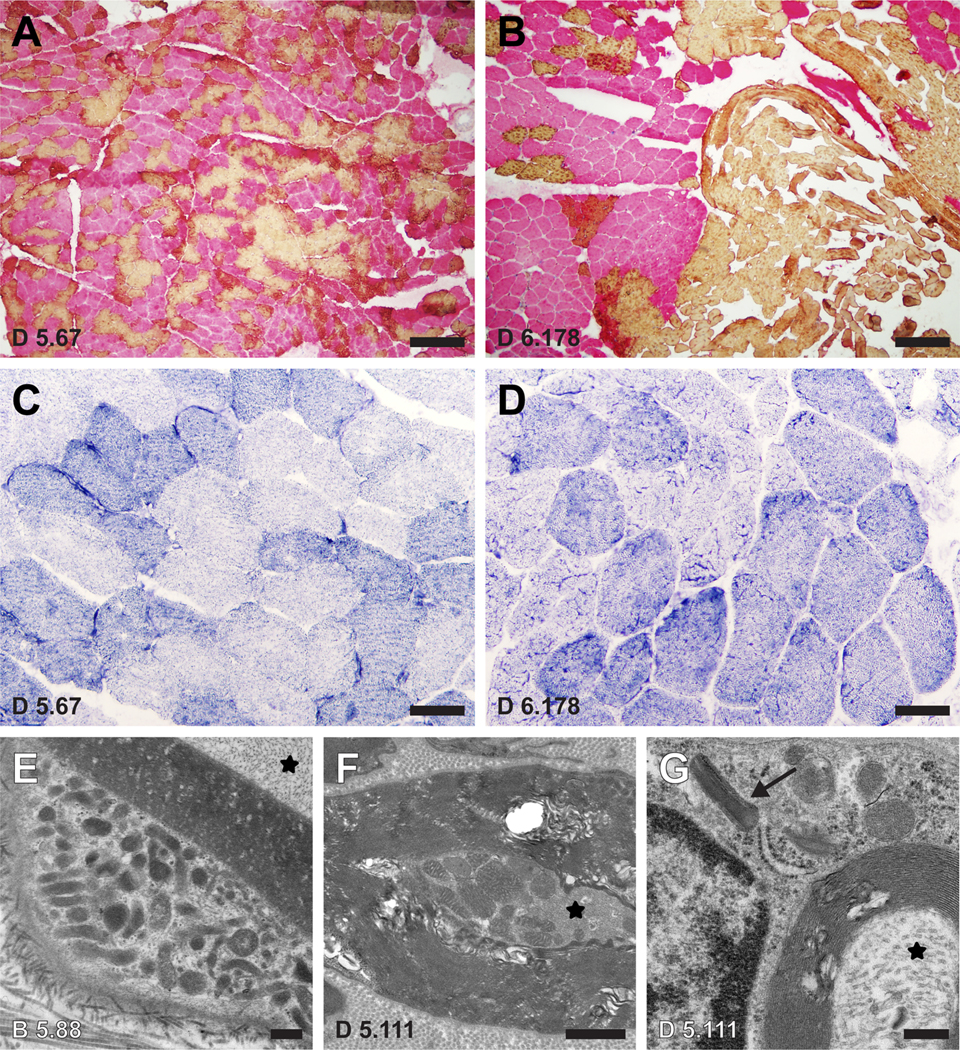
A-B Dual immunohistochemistry for slow myosin (yellow; type 1 fibers) and fast myosin (pink; type 2 fibers) shows a much greater degree of fiber-type grouping in a muscle biopsy from a moderately-severely affected family member (D 6.178; panel B) compared to a biopsy from an asymptomatic family member (D 5.67; panel A). Both biopsies show a significant population of hybrid fibers that co-express both myosin proteins (orange), evidence of recent reinnervation. C-D Coarsened internal architecture is noted on NADH-TR stain in the more affected individual (D) compared to the asymptomatic Individual (C). E-G Representative electron micrographs from nerve biopsies obtained from two other affected family members (B 5.88 and D 5.111) show mitochondrial hyperplasia and hypertrophy in the cytoplasm of a Schwann cell (E) and a small myelinated axon (F). Crystalline arrays are seen in an abnormal Schwann cell mitochondrion (arrow in G). For orientation, axonal cytoplasm is marked with an asterisk in each image. Scale bars: A-B, 10 μm; C-D, 50 μm; E, 0.4 μm; F, 1.0 μm; G, 0.3 μm.
Ultrastructural studies of muscle samples revealed mild mitochondrial hyperplasia and mildly increased glycogen, with no significant change in mitochondrial morphology (not shown). By contrast, electron microscopy of lateral femoral cutaneous nerve of two affected subjects (B 5.88, D 5.111) revealed multiple mitochondrial abnormalities, including mitochondrial hyperplasia, mitochondrial hypertrophy, and the presence of mitochondrial crystalline arrays (Figures 2E–2G).
Tissue biochemical analyses
Biochemical analysis of electron transport chain enzyme activities from four family members (B 6.28, D 5.67, D 6.146, D 6.178) revealed mildly to moderately reduced activity of citrate synthase in all samples, with reduction of activities of multiple enzymes in affected individuals compared to the unaffected individual’s muscle. Rotenone-sensitive complex I+III activity and complex IV activity showed more striking reductions (Table 4) in the more severely affected individuals (B6.28, D6.178) than in the unaffected carrier and mildly affected individual (D6.146, D5.67).
Table 4.
Electron Transport Chain Enzyme Activities (% Normal), mtDNA Content and Immunohistochemistry of Electron Transport Chain Enzymes from Muscle Biopsies of Four Family Members.
| Subject Pedigree # (Disease Severity) | I (%) | I + III (%) | I + III Rotenone-Sensitive (%) | II (%) | II + III (%) | IV (%) | mtDNA Content (% Control) | Electron Transport Chain Immunostaining |
|---|---|---|---|---|---|---|---|---|
| B 6.28 (Moderate) | 65 | 97 | 38 | 97 | 67 | 39 | 111 | Reduced IV-I, IV-IV, V Expression (< 25% of Fibers) |
| D 6.178 (Moderate-Severe) | 69 | 98 | 45 | 120 | 53 | 51 | 84 | Rare III, IV-I, IV-IV-Deficient Fibers |
| D 6.146 (Mild) | 85 | 95 | 93 | 149 | 85 | 80 | 92 | Normal |
| D 5.67 (Asymptomatic) | 79 | 103 | 103 | 122 | 88 | 71 | 152 | Reduced IV-I, IV-II Expression (<25 % of fibers) Rare I, IV-I, IV-IV-Deficient Fibers |
Northern blot analysis with control and subject total RNA isolated from muscle tissue revealed a striking reduction in the quantity of mt-tRNAVal in the subjects compared to controls (Figure 3D). The more severely affected individuals (D6.178 and B6.28) had a greater reduction than the less affected individuals (D6.146). In contrast, levels of mt-tRNALeu(UUR) were similar between subjects and controls (not shown). For quantitative comparison, the level of each tRNA was normalized to that of the mitochondria-localized but nuclear-encoded 5S rRNA of each sample. To minimize the tissue variability among samples, the 5S rRNA-normalized level of mt-tRNAVal was compared relative to the 5S rRNA-normalized level mt-tRNALeu(UUR) in each sample. This analysis confirmed the severe reduction of mt-tRNAVal in all subjects, with reduction by 80% for more severely affected individuals (Figure 3E). In contrast, Northern blot analysis revealed an increase to 110–120% in the quantity of mt-tRNAPhe in all samples (Figure 3E).
Figure 3.

Relative abundance of mt-tRNAVal in control and patient muscle. Two control samples (#2 and #3) and four patient samples (D 6.146, female 24, 18/01/1994; B 6.28, female 27, 25/01/1991; D 6.178, female 45, 14/08/1972; and D 5.67, female 41, 14/10/1978) were collected and analyzed. (A-C) A representative Northern blot analysis of (A) mt-tRNAVal, (B) mt-tRNAPhe, and (C) mt-tRNALeu(UUR) in muscle. The abundance of each tRNA relative to 5S rRNA in each sample is calculated and normalized to that in control #2 as the percentage at the bottom of each lane. (D) Bar graphs showing the 5S rRNA-normalized levels of mt-tRNAVal vs. mt-tRNAPhe. Data are the average of three Northern blot experiments as shown in (A-C). (E) Bar graphs showing the mt-tRNALeu(UUR)-normalized levels of mt-tRNAVal vs. mt-tRNAPhe. Data are the average of three Northern blot experiments as shown in (A-C).
Discussion
We present a Venezuelan family with a motor and sensory axonal neuropathy, and an extensive pedigree consistent with mitochondrial inheritance. Next-generation sequencing of the mitochondrial genome of affected family members revealed a homoplasmic m.1661A>G mutation in the mt-tRNAVal gene. This mutation has been reported in a Portuguese patient with seizures, trunk hypotonia, developmental delay, hyperlactatemia, and muscle biochemistry, showing generalized deficiency of all electron transport chain enzyme activities (24), although this individual has a second mutation at nucleotide 1655 of mt-tRNAVal, corresponding to nucleotide 58 in the tRNA T-loop. The 1661A>G mutation is in the stem region of the tRNA T-loop (Figure 4A), and is classified as a variant of unknown significance (25). It has been reported in one individual in MITOMAP with a frequency of 0.0002 % (26) without any clinical information, but is not reported in other clinical databases. In the family reported here, the mt-tRNAVal mutation is homoplasmic in blood and muscle.
Figure 4.

Human mt-tRNAVal. (A) Sequence and cloverleaf structure of human mt-tRNAVal in the standard nucleotide numbering framework of tRNA, showing the acceptor stem, the D (dihydrouridine)-loop, the anticodon, the variable region, and the T (thymidine)-loop. The site of m.1661A>G mutation is marked by an arrow, corresponding to an A64G mutation in mt-tRNAVal. (B) Location of human mt-tRNAVal within the cryo-EM (electron microscopy) structure of the human mitoribosome near the central protuberance of the mitoribosome large subunit (mt-LSU, shown in green). The human mitoribosome small subunit (mt-SSU, shown in yellow) is next to the mt-LSU, marked by the head domain and the body domain. (C) The tertiary structure of human mt-tRNAVal as derived from the cryo-EM structure of the human mitoribosome in (B). The backbone of m.1661A in the structure of the tRNA (shown in cyan) is broken.
We considered modes of inheritance other than mtDNA transmission, through linkage analysis and whole exome sequencing of three affected family members and one obligate carrier. There was no evidence of linkage to any chromosomal locus, and whole exome sequencing did not reveal any candidate mutations that segregate with the disease phenotype (data not shown). Lack of male transmission could indicate an X-linked inheritance pattern, but the similar age of onset and disease severity between males and females makes a loss-of-function X-linked mutation unlikely. Thus, pedigree analysis argues for mitochondrial transmission in this family. While mtDNA-related diseases are often more severe as the percent heteroplasmy of the mtDNA mutation increases, the most common mtDNA disease, Leber’s hereditary optic neuropathy (LHON), is caused by homoplasmic mutations, most commonly in the complex I subunit ND1 (27). Another intriguing feature of LHON is reduced penetrance (28). Thus, our family’s restriction of disease to primarily a single tissue, peripheral nerves, with homoplasmic mutation and reduced penetrance, shares several features with LHON.
Biochemical analysis of mitochondrial respiratory chain enzymes provides further support for a mitochondrial disease in this family: there is selective reduction in complexes I+III and IV in skeletal muscle from more severely affected family members compared to a clinically unaffected and mildly affected family member. Such effects on multiple respiratory chain complex activities are typical of mt-tRNA mutations, which impact the synthesis of multiple mtDNA-encoded proteins (29). Furthermore, the affected individuals all show low level, large mtDNA deletions in skeletal muscle that are not present in the asymptomatic individual. These deletions suggest that symptomatic subjects have mitochondrial dysfunction that leads to accumulation of deletions in mtDNA (30, 31), providing further evidence for a mitochondrial defect underlying the disease.
Pathogenicity of the mt-tRNAVal mutation is supported by reduction of tRNA levels in family members’ muscle when compared to levels of mt-tRNALeu(UUR). Analysis of the relative levels of mt-tRNAVal across samples (Figure 3E) reveals that subject biopsies show a reduction between 50 – 80% compared to controls. The mechanism of reduced levels of mt-tRNAVal may be reduced transcription, decreased stability, or altered post-transcriptional modification. It is not clear whether there is even greater depletion of mt-tRNAVal, beyond the 80% reduction seen in muscle, in peripheral nerves of affected family members. The reduction of mt-tRNAVal raises the possibility that protein synthesis of mtDNA genes that are enriched with valine codons (GUN) may be preferentially affected. This may explain the more profound decrease in enzyme activities of complexes I + IV. Based on prior reports of patients with mutations in mt-tRNAVal (32–36) and mitochondrial valyl-tRNA synthetase (VARS2) (37,38), complexes I and IV are most impacted by deficiency of valine incorporation during translation. In addition, analysis of mtDNA-encoded proteins revealed that complexes I and IV have higher percent valine (4% and 6%, in 7 and 3 subunits, respectively) compared to complexes III and V (2.6% and 3% in 1 and 2 subunits, respectively).
The primary role of mt-tRNAVal is to bring charged valine, in a reaction catalyzed by mitochondrial VARS2, to the ribosome for translation of valine codons during mitochondrial protein synthesis. However, mt-tRNAVal has another important function, serving as a structural component of human mitochondrial ribosomes (mitoribosomes) (39). In the cryo-EM structure of human mitoribosomes (40), mt-tRNAVal is localized to the same position as the 5S rRNA in cytoplasmic ribosomes. The mt-RNAVal at this position interacts with the mitochondrial rRNA nucleotide U1648 and with large subunit proteins (including mL38) to form the central protuberance of the large ribosomal subunit (Figure 4B). This central protuberance provides the substrate for the decoding center of the small ribosomal subunit to establish ribosomal protein synthesis activity. The pathogenicity of the mt-tRNAVal mutation (Figure 4C) may disrupt the contact with U1648, which could affect the interaction with mL38. Additionally, reduced levels of mt-tRNAVal could reduce the structural stability of mitoribosomes and impact mitochondrial protein translation. When steady-state levels of mt-tRNAVal are depleted, human mitoribosome biogenesis displays an adaptive response by switching to the incorporation of mt-tRNAPhe to generate translationally competent machinery (41). Consistent with this notion, levels of mt-tRNAPhe in our subjects showed a mild increase (Figure 3E). This increase may arise from mitochondrial proliferation that is often seen in individuals with mitochondrial diseases, and may compensate for loss of mt-tRNAVal to stabilize mitoribosome structure.
Given that a mt-tRNA mutation would interfere with mitochondrial function in any cell with high metabolic demands, a curious aspect of this family’s disease is the preferential involvement of peripheral nerves in a length-dependent pattern. The localization to longer, myelinated nerves suggests that there may be a disruption of axonal transport of mitochondria (42,43), perhaps related to mitochondrial hypertrophy and congestion of the cross-sectional volume of axons. Another possibility is that mitochondrial stress (44) is greater at more distal axonal locations, and that metabolic disruption occurs at the ends of the longest nerves, followed by axon loss (45). The length of these nerves may be a barrier to delivery of newly synthesized mitochondria or recycling of damaged mitochondria (46), or mitochondrial fusion (47) and fission (48) may be impaired. Perhaps compensatory mitochondrial proliferation and hypertrophy are less effective at rescuing metabolic stress in longer axons (49) than in other metabolically active tissues, such as skeletal or cardiac muscle, or brain. An unexpected pathological finding in our study was the presence of similar mitochondrial abnormalities in both axons and Schwann cells. Electrophysiological findings in patients suggest that axonal dysfunction is the primary mediator of this disease, so Schwann cell abnormalities may be secondary to axonal pathology. Reports of both axonal and demyelinating neuropathies in patients with GDAP1 mutations (50) indicate that mitochondrial disruption can lead to neuropathy through effects in both neurons and Schwann cells.
Limitations of our study include the possibility of phenotypic mimics, especially with increasing patient age, because many diseases (e.g., diabetes mellitus, vitamin B12 deficiency, paraproteinemia) can cause peripheral neuropathy. Furthermore, genetic material and nerve conduction studies were available only from a limited number of family members, so we may have underestimated the number of family members with this disease; however, the lack of male disease transmission argues that the mtDNA obtained from several affected family members should be adequate for identifying the pathogenic mutation. Finally, we cannot exclude the possibility that another mutation contributes to the phenotype. Specifically, we identified a mutation in the complex I subunit, ND1, I273V, which is too common in population databases at 0.04 % (26) to be pathogenic in isolation, but which could synergistically enhance the effect of the mt-tRNAVal mutation. If this were the case, however, one might expect complex I activity and immunolabeling to be disproportionately reduced compared to other complexes; however, complex IV appears to be the most affected part of the respiratory chain in this family.
In summary, we have identified a mt-tRNAVal mutation as the cause of Charcot-Marie-Tooth disease in a large, indigenous Venezuelan family, and support this conclusion with an extensive pedigree, genetic analysis of blood and muscle, biochemical studies of the mitochondrial electron transport chain, tRNA quantification, and histological and ultrastructural analysis of muscle and sensory nerves in several affected family members. The mt-tRNAVal mutation causes a selective reduction in the level of this tRNA. The mt-tRNAVal is unique among mtRNAs in its dual roles: it functions both in mitochondrial translation to add valine to growing peptide chains, and is also a component of the mitoribosome (40). Further studies will be necessary to clarify which of these roles is impaired by the m.1661A>G mutation. It would be of great interest to better understand genetic and environmental factors that influence the penetrance of this homoplasmic mutation. In the case of LHON, for example, tobacco and alcohol consumption have been suggested as modifying factors (27). While we have identified a possible compensation for the mutation, increased production of mt-tRNAPhe, there may be environmental or genetic modifiers of this family’s phenotype that allow compensation for reduced levels of mt-tRNAVal. Our findings also suggest that mtDNA sequencing can be considered for patients with CMT without a genetic diagnosis, even if no other features of mitochondrial disease are present.
Supplementary Material
Acknowledgments
First, we are grateful to all the family members willing to be a part of this study. We thank Dr. Salvatore Billi DiMauro for thoughtful comments on the manuscript. AJF thanks Dr. William Dobyns for early advice on the pedigree, and other faculty mentors in the K12 CNCDP. YG thanks Dr. Zadila Suarez for advice on study design, Dr. Ximena Páez for supervision of the ethical aspects of this project and medical student Carlos Molina for contributions to experimental work. We also thank Sean Thomas in the Gladstone Institutes for data analysis of SNP microchip data and Christine Lin in UCSF Department of Pathology for help with Figure 3. AJF was supported by NIH-K12NS001692 Award A123822. YG was supported by Grant M-869–06-07-B from C.D.C.H.T, ULA, Mérida, Venezuela and by the Alma Mater program from OPSU, Caracas, Venezuela. YMH was supported by NIH-R01GM126210 and by NIH-R01AI139202. MM was supported by the Muscular Dystrophy Association grant MDA514303.
Footnotes
Potential Conflicts of Interest: None
References
- 1.Laurá M, Pipis M, Rossor AM, Reilly MM. Charcot-Marie-Tooth disease and related disorders: an evolving landscape. Curr Opin Neurol. 2019. October;32(5):641–650. [DOI] [PubMed] [Google Scholar]
- 2.McKinney JL, De Los Reyes EC, Lo WD, Flanigan KM. Recurrent central nervous system white matter changes in Charcot-Marie-tooth type X disease. Muscle Nerve. 2014. March;49(3):451–4. [DOI] [PubMed] [Google Scholar]
- 3.Orengo JP, Khemani P, Day JW, et al. Charcot Marie Tooth disease type 4J with complex central nervous system features. Ann Clin Transl Neurol. 2018. January 22;5(2):222–225. [DOI] [PMC free article] [PubMed] [Google Scholar]
- 4.Brockmann K, Dreha-Kulaczewski S, Dechent P, et al. Cerebral involvement in axonal Charcot-Marie-Tooth neuropathy caused by mitofusin2 mutations. J Neurol. 2008. July;255(7):1049–58. [DOI] [PubMed] [Google Scholar]
- 5.Yang Y, Gu LQ, Burnette WB, Li J. N98S mutation in NEFL gene is dominantly inherited with a phenotype of polyneuropathy and cerebellar atrophy. J Neurol Sci. 2016. June 15;365:46–7. [DOI] [PMC free article] [PubMed] [Google Scholar]
- 6.Menezes MP, Ouvrier RA. Peripheral neuropathy associated with mitochondrial disease in children. Dev Med Child Neurol. 2012. May;54(5):407–14. [DOI] [PubMed] [Google Scholar]
- 7.Pareyson D, Piscosquito G, Moroni I, et al. Peripheral neuropathy in mitochondrial disorders. Lancet Neurol. 2013. October;12(10):1011–24. [DOI] [PubMed] [Google Scholar]
- 8.Beerepoot S, Nierkens S, Boelens JJ, et al. Peripheral neuropathy in metachromatic leukodystrophy: current status and future perspective. Orphanet J Rare Dis. 2019. November 4;14(1):240. [DOI] [PMC free article] [PubMed] [Google Scholar]
- 9.Ranieri M, Bedini G, Parati EA, Bersano A. Fabry Disease: Recognition, Diagnosis, and Treatment of Neurological Features. Curr Treat Options Neurol. 2016. July;18(7):33. [DOI] [PubMed] [Google Scholar]
- 10.Linnemann C, Tezenas du Montcel S, Rakowicz M, et al. Peripheral Neuropathy in Spinocerebellar Ataxia Type 1, 2, 3, and 6. Cerebellum. 2016. April;15(2):165–73. [DOI] [PubMed] [Google Scholar]
- 11.Morral JA, Davis AN, Qian J, et al. Pathology and pathogenesis of sensory neuropathy in Friedreich’s ataxia. Acta Neuropathol. 2010. July;120(1):97–108. [DOI] [PubMed] [Google Scholar]
- 12.Karle KN, Schüle R, Klebe S, et al. Electrophysiological characterisation of motor and sensory tracts in patients with hereditary spastic paraplegia (HSP). Orphanet J Rare Dis. 2013. October 9;8:158. [DOI] [PMC free article] [PubMed] [Google Scholar]
- 13.Lee JR, Srour M, Kim D, et al. De novo mutations in the motor domain of KIF1A cause cognitive impairment, spastic paraparesis, axonal neuropathy, and cerebellar atrophy. Hum Mutat. 2015. January;36(1):69–78. [DOI] [PubMed] [Google Scholar]
- 14.Pitceathly RD, Murphy SM, Cottenie E, et al. Genetic dysfunction of MT-ATP6 causes axonal Charcot-Marie-Tooth disease. Neurology. 2012. September 11;79(11):1145–54. [DOI] [PMC free article] [PubMed] [Google Scholar]
- 15.Pareyson D, Saveri P, Sagnelli A, Piscosquito G. Mitochondrial dynamics and inherited peripheral nerve diseases. Neurosci Lett. 2015. June 2;596:66–77. [DOI] [PubMed] [Google Scholar]
- 16.Stuppia G, Rizzo F, Riboldi G, et al. MFN2-related neuropathies: Clinical features, molecular pathogenesis and therapeutic perspectives. J Neurol Sci. 2015. September 15;356(1–2):7–18. [DOI] [PubMed] [Google Scholar]
- 17.Cassereau J, Chevrollier A, Gueguen N, et al. Mitochondrial dysfunction and pathophysiology of Charcot-Marie-Tooth disease involving GDAP1 mutations. Exp Neurol. 2011. January;227(1):31–41. [DOI] [PubMed] [Google Scholar]
- 18.Echaniz-Laguna A, Ghezzi D, Chassagne M, et al. SURF1 deficiency causes demyelinating Charcot-Marie-Tooth disease. Neurology. 2013. October 22;81(17):1523–30. [DOI] [PMC free article] [PubMed] [Google Scholar]
- 19.Sivakumar K, Kyriakides T, Puls I, et al. Phenotypic spectrum of disorders associated with glycyl-tRNA synthetase mutations. Brain. 2005. October;128(Pt 10):2304–14. [DOI] [PubMed] [Google Scholar]
- 20.Kaufmann P, Pascual JM, Anziska Y, et al. Nerve conduction abnormalities in patients with MELAS and the A3243 G mutation. Arch Neurol. 2006. May;63(5):746–8. [DOI] [PubMed] [Google Scholar]
- 21.Graf WD, Sumi SM, Copass MK, et al. Phenotypic heterogeneity in families with the myoclonic epilepsy and ragged-red fiber disease point mutation in mitochondrial DNA. Ann Neurol. 1993. June;33(6):640–5. [DOI] [PubMed] [Google Scholar]
- 22.Saneto RP. Genetics of Mitochondrial Disease. Adv Genet. 2017;98:63–116. [DOI] [PubMed] [Google Scholar]
- 23.Preston DC, Shapiro BE. Electromyography and neuromuscular disorders. Boston: Butterworth-Heinemann; 1998. [Google Scholar]
- 24.Bacalhau M, Pratas J, Simões M, et al. In silico analysis for predicting pathogenicity of five unclassified mitochondrial DNA mutations associated with mitochondrial cytopathies’ phenotypes. Eur J Med Genet. 2017. March;60(3):172–177. [DOI] [PubMed] [Google Scholar]
- 25.https://www.ncbi.nlm.nih.gov/clinvar/variation/370043, November 30, 2019.
- 26.www.mitomap.org, November 23, 2019.
- 27.Caporali L, Maresca A, Capristo M, et al. Incomplete penetrance in mitochondrial optic neuropathies. Mitochondrion. 2017. September;36:130–137. [DOI] [PubMed] [Google Scholar]
- 28.Valentino ML, Barboni P, Ghelli A, et al. The ND1 gene of complex I is a mutational hot spot for Leber’s hereditary optic neuropathy. Ann Neurol. 2004. November; 56(5):631–41. [DOI] [PubMed] [Google Scholar]
- 29.Abbott JA, Francklyn CS, Robey-Bond SM. Transfer RNA and human disease. Front Genet. 2014. June 3;5:158. [DOI] [PMC free article] [PubMed] [Google Scholar]
- 30.Amati-Bonneau P, Valentino ML, Reynier P, et al. OPA1 mutations induce mitochondrial DNA instability and optic atrophy ‘plus’ phenotypes. Brain. 2008. February; 131(Pt 2):338–51. [DOI] [PubMed] [Google Scholar]
- 31.Rouzier C, Bannwarth S, Chaussenot A, et al. The MFN2 gene is responsible for mitochondrial DNA instability and optic atrophy ‘plus’ phenotype. Brain. 2012. January; 135(Pt 1):23–34. [DOI] [PubMed] [Google Scholar]
- 32.Toyoshima Y, Tanaka Y, Satomi K. MELAS syndrome associated with a new mitochondrial tRNA-Val gene mutation (m.1616A>G). BMJ Case Rep. 2017. September 11;2017. [DOI] [PMC free article] [PubMed] [Google Scholar]
- 33.Glatz C, D’Aco K, Smith S, Sondheimer N. Mutation in the mitochondrial tRNA(Val) causes mitochondrial encephalopathy, lactic acidosis and stroke-like episodes. Mitochondrion. 2011. July;11(4):615–9. [DOI] [PMC free article] [PubMed] [Google Scholar]
- 34.Horváth R, Bender A, Abicht A, et al. Heteroplasmic mutation in the anticodon-stem of mitochondrial tRNA(Val) causing MNGIE-like gastrointestinal dysmotility and cachexia. J Neurol. 2009. May;256(5):810–5. [DOI] [PubMed] [Google Scholar]
- 35.McFarland R, Clark KM, Morris AA, Taylor RW, Macphail S, Lightowlers RN, Turnbull DM. Multiple neonatal deaths due to a homoplasmic mitochondrial DNA mutation. Nat Genet. 2002. February;30(2):145–6. [DOI] [PubMed] [Google Scholar]
- 36.Fraidakis MJ, Jardel C, Allouche S, et al. Phenotypic diversity associated with the MT-TV gene m.1644G>A mutation, a matter of quantity. Mitochondrion. 2014. March;15:34–9. [DOI] [PubMed] [Google Scholar]
- 37.Bruni F, Di Meo I, Bellacchio E, et al. Clinical, biochemical, and genetic features associated with VARS2-related mitochondrial disease. Hum Mutat. 2018. April;39(4):563–578. [DOI] [PMC free article] [PubMed] [Google Scholar]
- 38.Diodato D, Melchionda L, Haack TB, et al. VARS2 and TARS2 mutations in patients with mitochondrial encephalomyopathies. Hum Mutat. 2014. August;35(8):983–9. [DOI] [PMC free article] [PubMed] [Google Scholar]
- 39.Amunts A, Brown A, Toots J, et al. Ribosome. The structure of the human mitochondrial ribosome. Science. 2015;348(6230):95–98. [DOI] [PMC free article] [PubMed] [Google Scholar]
- 40.Greber BJ, Boehringer D, Leibundgut M, et al. The complete structure of the large subunit of the mammalian mitochondrial ribosome. Nature. 2014. November 13;515(7526):283–6. [DOI] [PubMed] [Google Scholar]
- 41.Rorbach J, Gao F, Powell CA, et al. Human mitochondrial ribosomes can switch their structural RNA composition. Proc Natl Acad Sci U S A. 2016. October 25;113(43):12198–12201. [DOI] [PMC free article] [PubMed] [Google Scholar]
- 42.Pareyson D, Saveri P, Sagnelli A, Piscosquito G. Mitochondrial dynamics and inherited peripheral nerve diseases. Neurosci Lett. 2015. June 2;596:66–77. [DOI] [PubMed] [Google Scholar]
- 43.Campbell PD, Shen K, Sapio MR, et al. Unique function of Kinesin Kif5A in localization of mitochondria in axons. J Neurosci. 2014. October 29;34(44):14717–32. [DOI] [PMC free article] [PubMed] [Google Scholar]
- 44.Niemann A, Huber N, Wagner KM,et al. The Gdap1 knockout mouse mechanistically links redox control to Charcot-Marie-Tooth disease. Brain. 2014. March;137(Pt 3):668–82. [DOI] [PMC free article] [PubMed] [Google Scholar]
- 45.Rumora AE, Savelieff MG, Sakowski SA, Feldman EL. Disorders of mitochondrial dynamics in peripheral neuropathy: Clues from hereditary neuropathy and diabetes. Int Rev Neurobiol. 2019;145:127–176. [DOI] [PMC free article] [PubMed] [Google Scholar]
- 46.Liao C, Ashley N, Diot A, et al. Dysregulated mitophagy and mitochondrial organization in optic atrophy due to OPA1 mutations. Neurology. 2017. January 10;88(2):131–142. [DOI] [PMC free article] [PubMed] [Google Scholar]
- 47.El Fissi N, Rojo M, Aouane A, et al. Mitofusin gain and loss of function drive pathogenesis in Drosophila models of CMT2A neuropathy. EMBO Rep. 2018. August;19(8). [DOI] [PMC free article] [PubMed] [Google Scholar]
- 48.Almutawa W, Smith C, Sabouny R, et al. The R941L mutation in MYH14 disrupts mitochondrial fission and associates with peripheral neuropathy. EBioMedicine. 2019. July;45:379–392. [DOI] [PMC free article] [PubMed] [Google Scholar]
- 49.Bernard-Marissal N, van Hameren G, Juneja M, et al. Altered interplay between endoplasmic reticulum and mitochondria in Charcot-Marie-Tooth type 2A neuropathy. Proc Natl Acad Sci U S A. 2019. February 5;116(6):2328–2337. [DOI] [PMC free article] [PubMed] [Google Scholar]
- 50.Nelis E, Erdem S, Van Den Bergh PY, et al. Mutations in GDAP1: autosomal recessive CMT with demyelination and axonopathy. Neurology. 2002. December 24;59(12):186. [DOI] [PubMed] [Google Scholar]
Associated Data
This section collects any data citations, data availability statements, or supplementary materials included in this article.