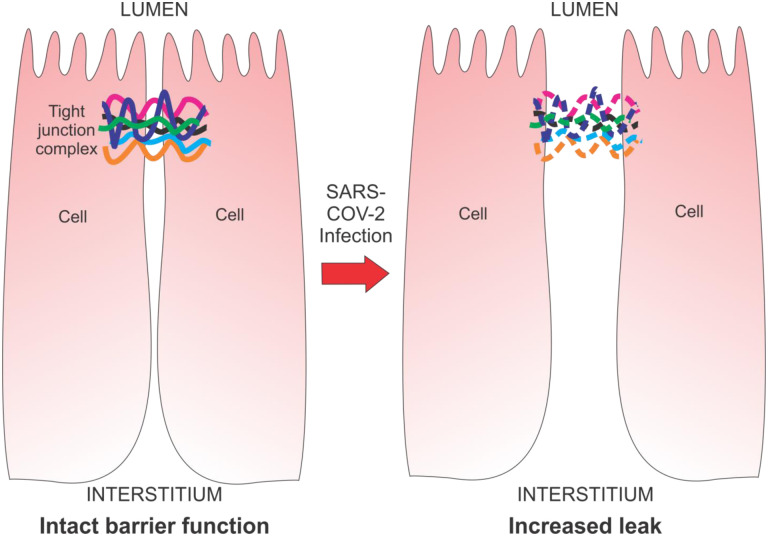
Fig. 4. Model diagram of potential damage to tight junction integrity and epithelia following infection by SARS-CoV-2.
Left - intact epithelial TJ complex and barrier function from lumen to interstitium. Cells are close together with solid colored lines representing TJ proteins ZO1, ZO2, ZO3, and PALS1. Right - compromised epithelial TJ complex (dotted colored lines) following SARS-CoV-2 infection and expression of E protein resulting in barrier disruption and increased paracellular transepithelial leak.

