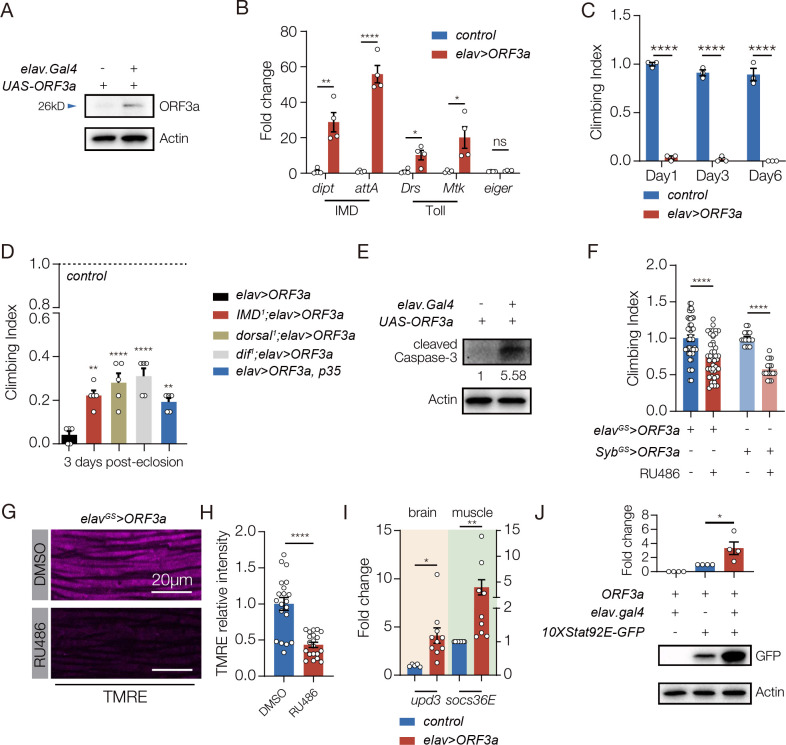
Figure 4. ORF3a induces neuroinflammation and reduces muscle performance in Drosophila.
A. Western blot. ORF3a protein was expressed in the brain of elav>ORF3a flies but not in control flies (UAS.ORF3a). ORF3a was detected at ~26kD. B. qRT-PCR. Transcripts encoding the antimicrobial peptides (AMPs) activated by the IMD pathway (Dipt and attA) and the Toll pathway (Drs and Mtk) were enriched in the brain of elav>ORF3a flies compared to controls (UAS.ORF3a). The cytokine eiger is a TNF orthologue that can induce apoptosis in response to infection (Igaki and Miura, 2014), but eiger expression was unchanged in elav>ORF3a flies. C. Climbing index. elav>ORF3a flies showed reduced climbing capacity compared to controls (UAS.ORF3a) at 1-, 3-, and 6-days after eclosion. D. Climbing index. elav>ORF3a flies with homozygous mutations affecting the IMD pathway (IMD1) or the Toll pathway (dorsal1, dif1) showed improved climbing capacity compared to elav>ORF3a flies. elav>ORF3a flies that expressed the inhibitor of apoptosis p35 in the CNS also showed im-proved climbing capacity compared to elav>ORF3a flies. Control flies (UAS.ORF3a) were used to establish the base of the index. E. Western blot. Cleaved Caspase-3 was enriched in the brain of elav>ORF3a flies compared to controls (UAS.ORF3a). F,G. elavGS.Gal4 and SybGS.Gal4 were activated in adult flies with RU486 to induce ORF3a expression in the CNS. F. Climbing index. elavGS>ORF3a and SybGS.ORF3a flies treated with RU486 showed re-duced climbing capacity compared to DMSO treated controls. G. Confocal micrographs of indirect flight muscles stained with TMRE (violet) to assess mitochondrial membrane poten-tial. Muscles from elavGS>ORF3a flies treated with RU486 showed less TMRE staining than DMSO treated controls. H. Quantification of the TMRE signal shown in G. I. qRT-PCR. elav>ORF3a flies expressed more upd3 in the brain and more socs36e in indirect flight mus-cles than control flies (UAS.ORF3a) at 7 days after eclosion. J. Western blot. GFP expression from the JAK/Stat activity reporter 10XStat92E.GFP in muscle was enriched in elav>ORF3a flies compared to controls (UAS.ORF3a). Significance was determined by two-sided unpaired Student’s t-test (F, H, I, J), two-way ANOVA (B, C), and one-way ANOVA (D). For Western blots and qRT-PCR, relative expression was determined for three biological replicates. See Fig. 1 legend for Climbing Index data points. Error bars represent SEM. (*) p< 0.05, (**) p< 0.01, (***) p< 0.001, (****) p < 0.0001, (ns) non-significant.

