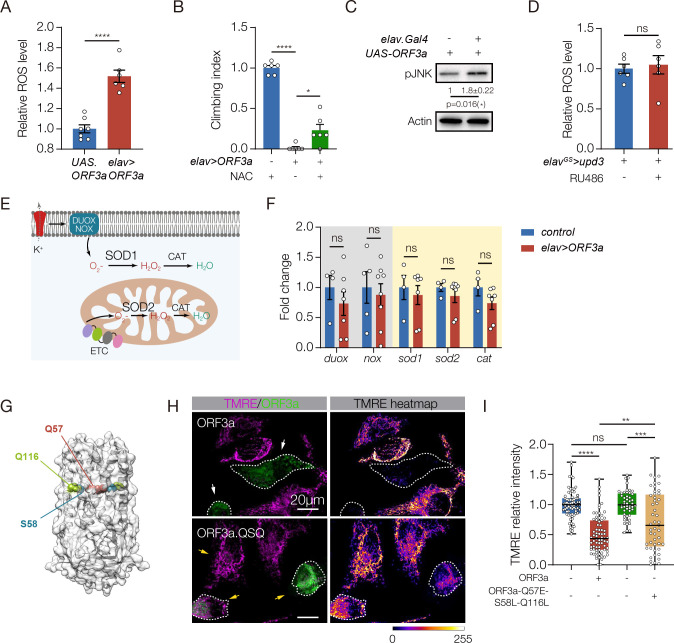
Figure 5. ORF3a enhances ROS in the brain and reduces mitochondrial function in skeletal muscle.
A. ROS assay. H2DCFDA was used to measure ROS in the brain. elav>ORF3a flies produced more ROS than controls (UAS.ORF3a). B. Climbing index. elav>ORF3a flies treated with the ROS inhibitor N-acetyl-L-cysteine (NAC) showed improved climbing capacity compared to vehicle-treated controls. Wild-type flies treated with NAC were used to establish the base of the index. C. Western blot. pJNK levels in the brain were enriched in elav>ORF3a flies compared to controls (UAS.ORF3a). D. ROS assay. elavGS>upd3 flies treated with RU486 accumulated more ROS in the brain than DMSO treated controls. E. Diagram of canonical ROS pathways. F. qRT-PCR. The expression of ROS-related transcripts in the brain was comparable between elav>ORF3a and control (UAS.ORF3a) flies. G. Cryo-EM structure of the ORF3a dimer, modified from (Kern et al., 2021). Residues positioned at the top of the polar cavity (Q57) or at the base of the hydrophilic grooves (S58, Q116) are shown. H. Micrographs of HeLA cells transfected with eGFP.ORF3a or triple mutant eGFP.ORF3a.QSQ (Q57E, S58L, Q116L), labeled for GFP (green) and TMRE (violet) to measure mitochondrial membrane potential. Cells transfected with wild-type ORF3a showed less TMRE fluorescence than cells transfected with ORF3a.QSQ. Dotted lines outline transfected cells. I. Quantification of TMRE fluorescence shown in H. Significance was determined by two-sided unpaired student’s t-test (A, C, D, F), and one-way ANOVA (B, I). For Western blots, qRT-PCR, and ROS assays relative expression was determined for a minimum of three biological replicates. See Fig. 1 legend for Climbing Index data points. Data points for TMRE expression represent fluorescence in a single transfected cell normalized to untransfected cells within the same field. n=10 fields. Error bars represent SEM. (*) p< 0.05, (**) p< 0.01, (***) p< 0.001, (****) p < 0.0001, (ns) non-significant.

