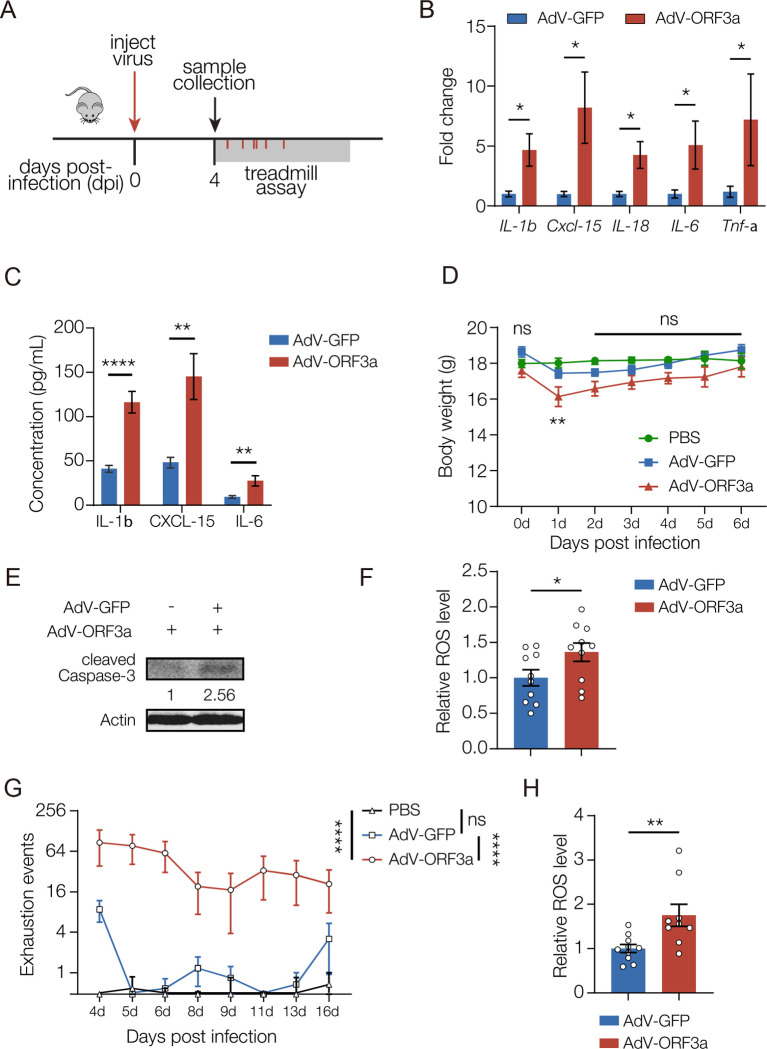
Figure 6. ORF3a induces neuroinflammation and reduces muscle performance in mice.
A. Experimental design to study the skeletal muscle response to ORF3a expression in mice. B. qRT-PCR. Transcripts encoding cytokines were enriched in the brain of AdV-ORF3a.GFP infected mice compared to AdV-GFP infected controls. n≥5. C. Enzyme-linked immunosorbent assay (ELISA). Cytokine protein levels were enriched in in the brain of AdV-ORF3a.GFP infected mice compared to AdV-GFP infected controls. n≥5. D. Body weight changes over time. Mice infected with AdV-ORF3a.GFP showed a temporary drop in body weight at 1dpi compared to PBS injected or AdV-GFP injected controls. n=6. E. Western blot. GFP-positive brain lysates from AdV-ORF3a.GFP infected mice contained more cleaved Caspase-3 than AdV-GFP infected mice. F. ROS assay. H2DCFDA was used to measure ROS levels in GFP-positive brain tissue. AdV-ORF3a.GFP infected mice produced more ROS than AdV-GFP infected mice. Each data point represents an individual mouse. G. Longitudinal forced treadmill-running assay. AdV-ORF3a.GFP infected mice showed more exhaustion events than AdV-GFP infected mice or PBS injected mice. n≥11. H. ROS assay. H2DCFDA was used to measure ROS levels in skeletal muscle. AdV-ORF3a.GFP infected mice produced more ROS than AdV-GFP infected mice. Each data point represents an individual mouse. Significance was determined by two-sided unpaired Student’s t-test (B, C, F, H), and one-way ANOVA (D, G). Error bars represent SEM. (*) p< 0.05, (**) p< 0.01, (****) p < 0.0001, (ns) non-significant.

