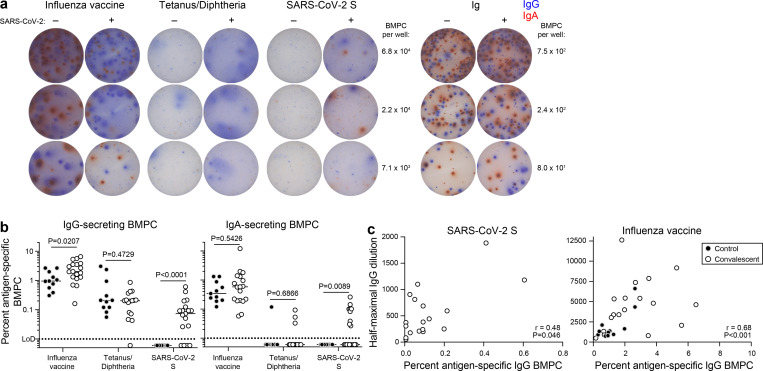
Figure 2. SARS-CoV-2 infection elicits long-lived BMPCs.
a) Example images of ELISpot wells coated with the indicated antigens or anti-Ig and developed in blue and red for IgG and IgA, respectively after incubation of magnetically enriched BMPC from convalescent and control participants. b) Frequencies of BMPC secreting IgG (left) or IgA (right) antibodies specific for the indicated antigens, indicated as percentages of total IgG- or IgA-secreting BMPC in convalescent (open circles) and control (closed circles) participants. Horizontal lines indicate medians. P-values from two-sided Mann-Whitney U-tests. c) Frequencies of IgG BMPC specific for S (left) and influenza virus vaccine (right) plotted against respective IgG titers in paired blood samples from convalescent patients 7 months post symptom onset (open circles) and control participants (closed circles). Each symbol represents one sample (n=18 convalescent, 11 control). P- and r-values from two-sided Spearman’s correlations.

